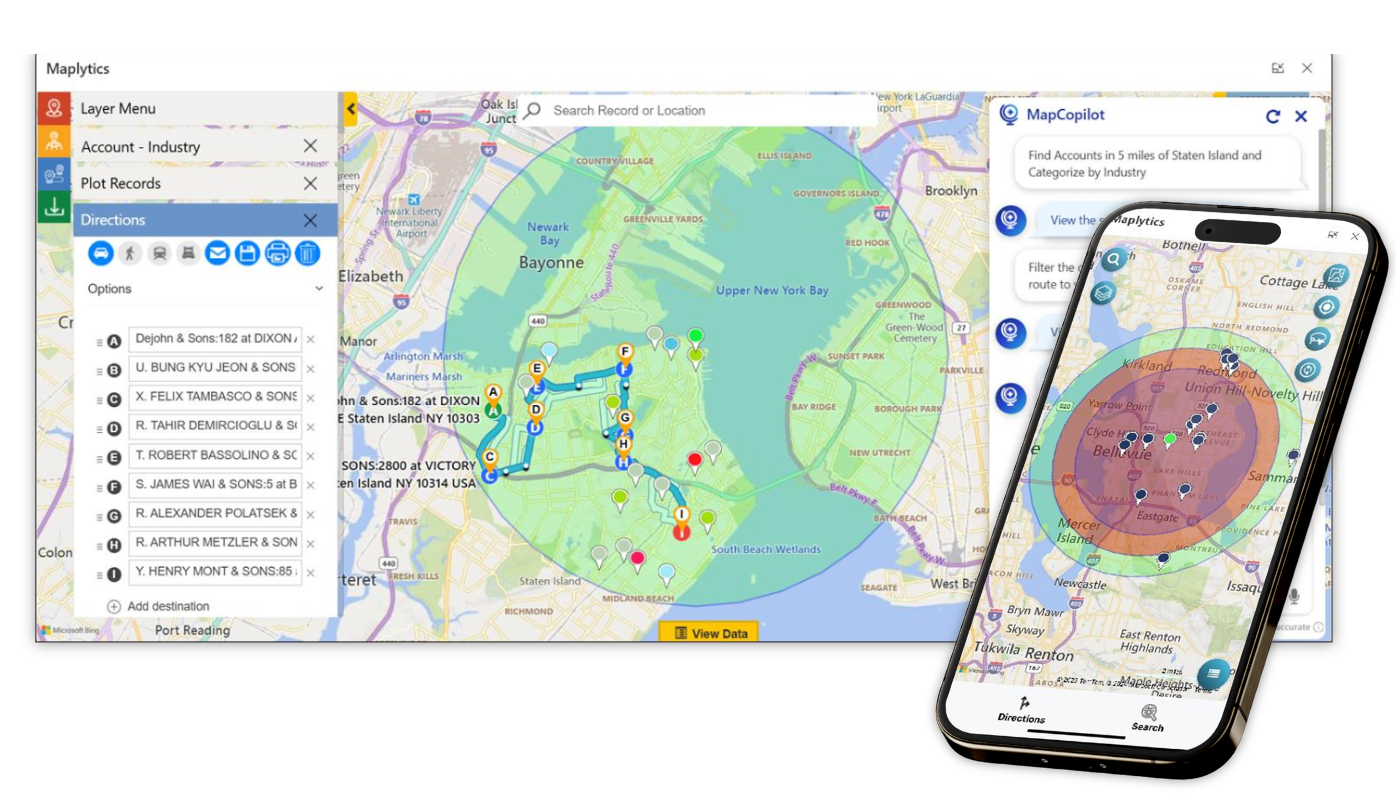
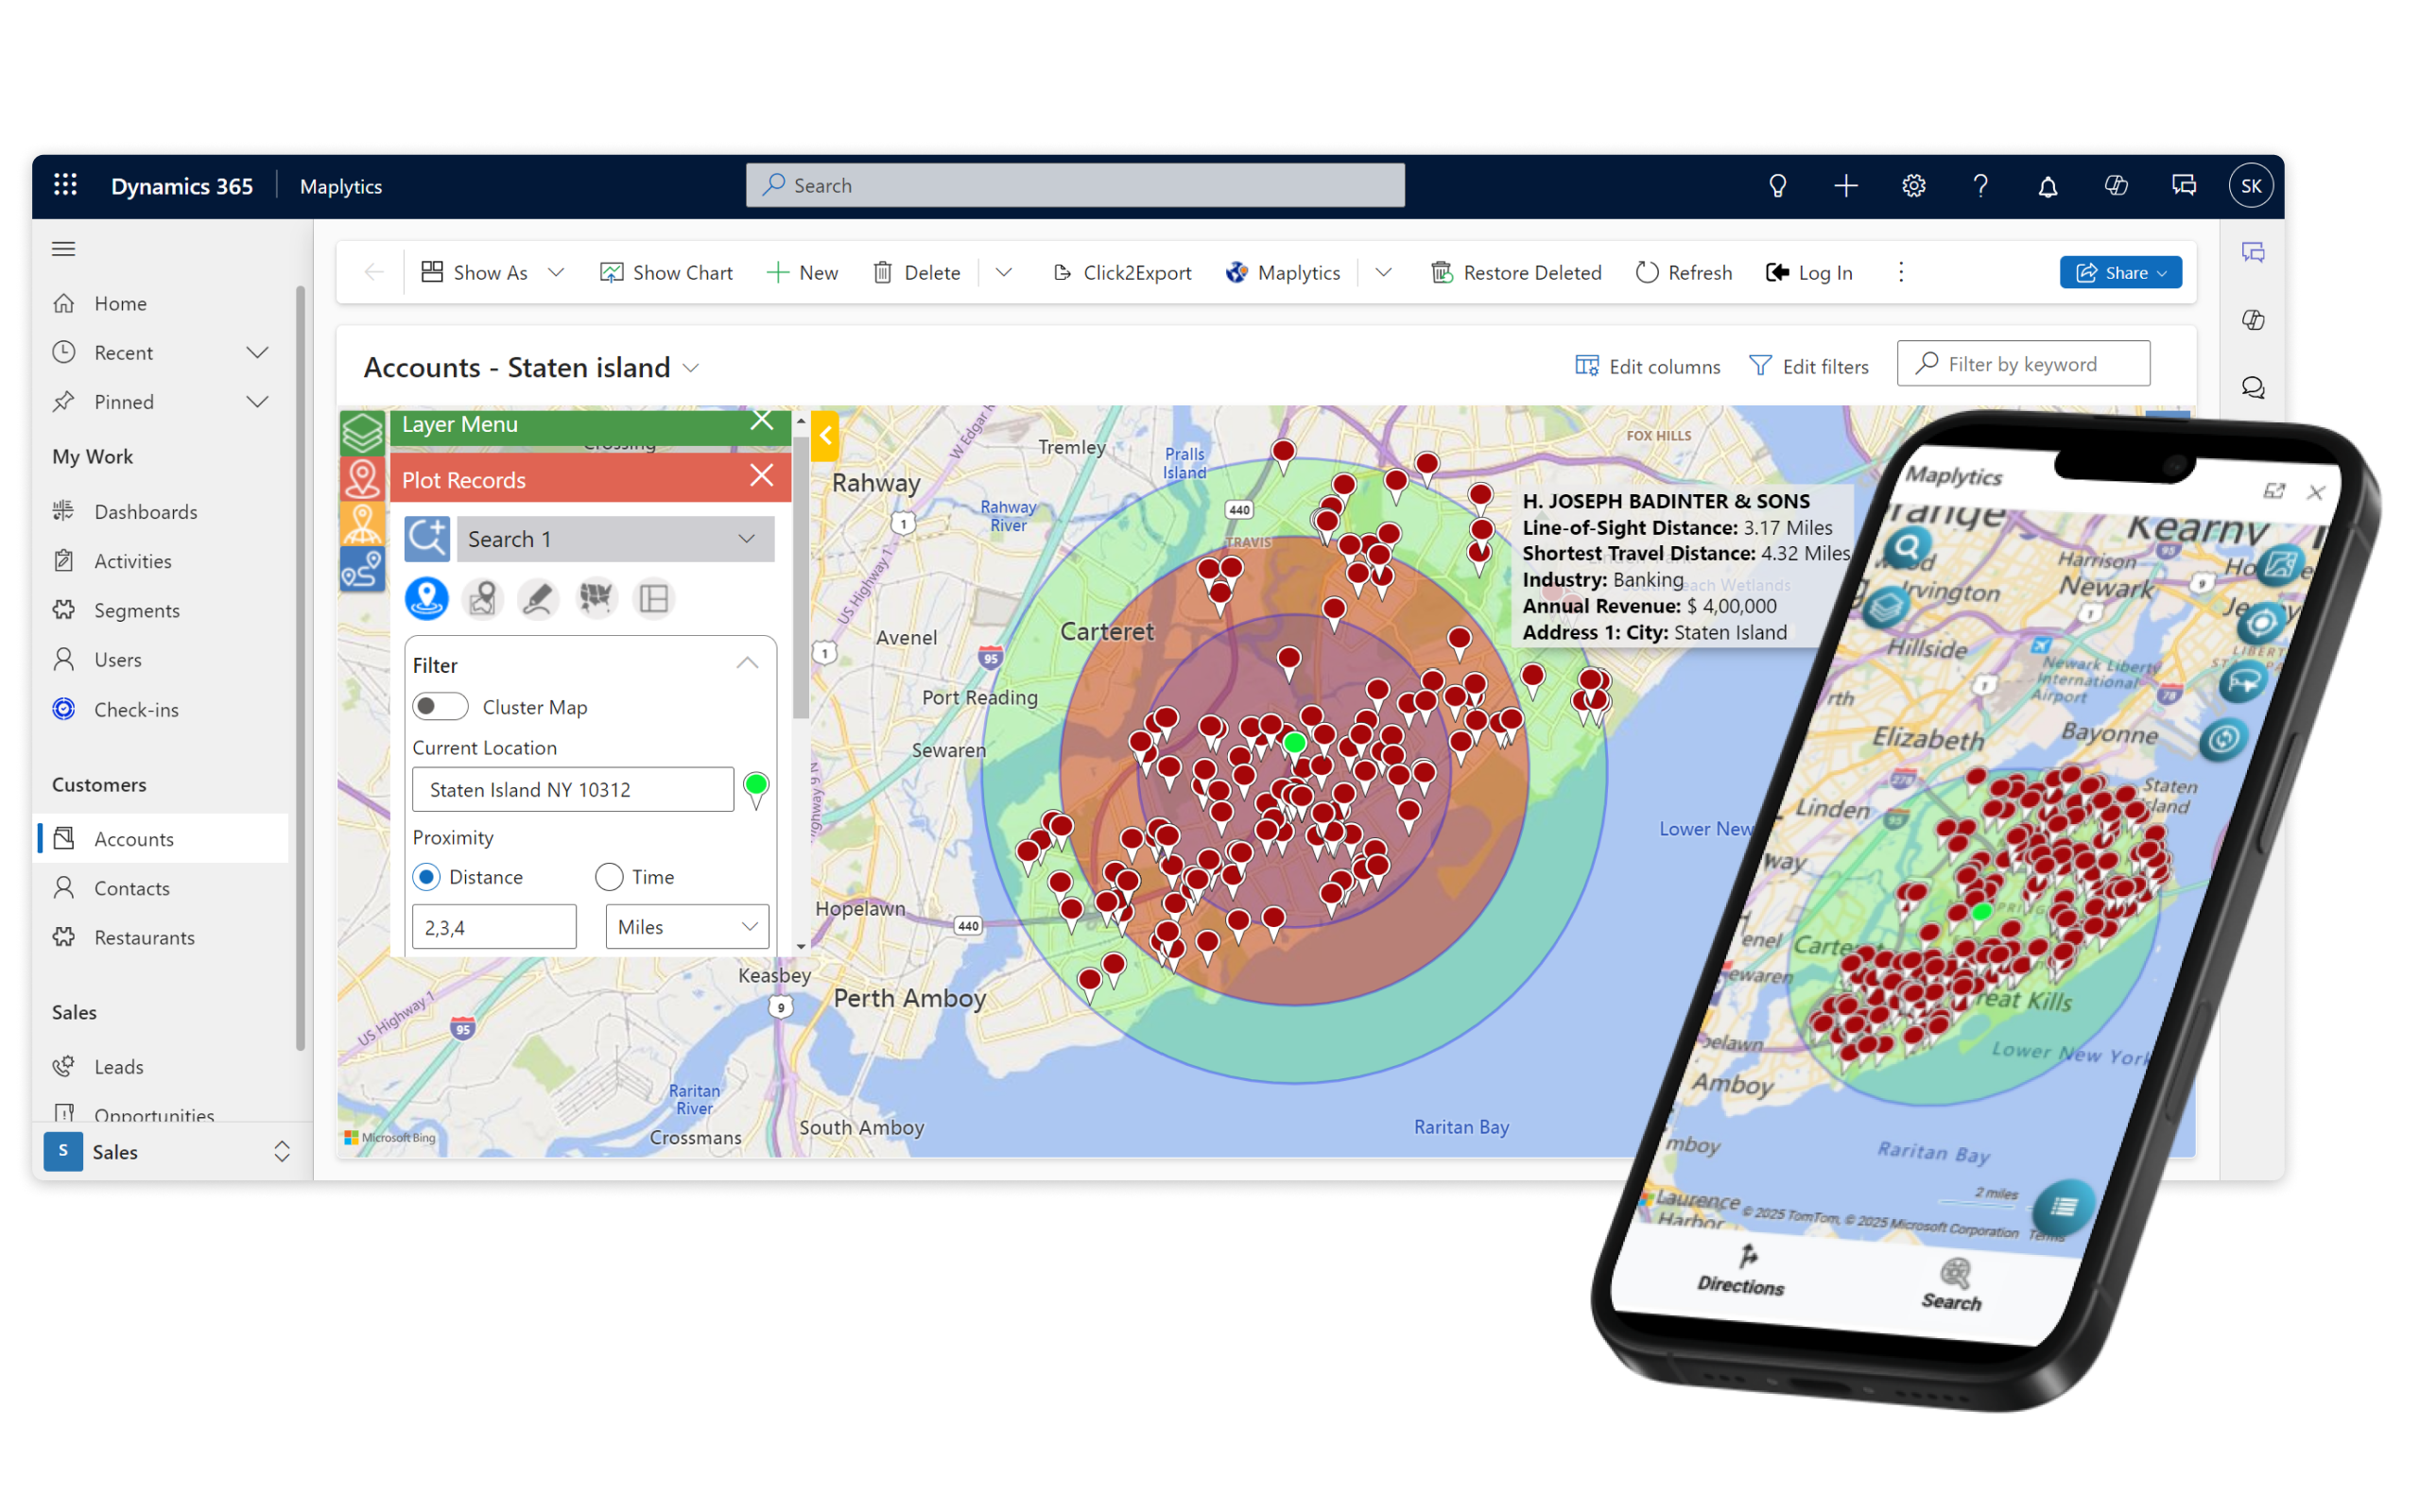
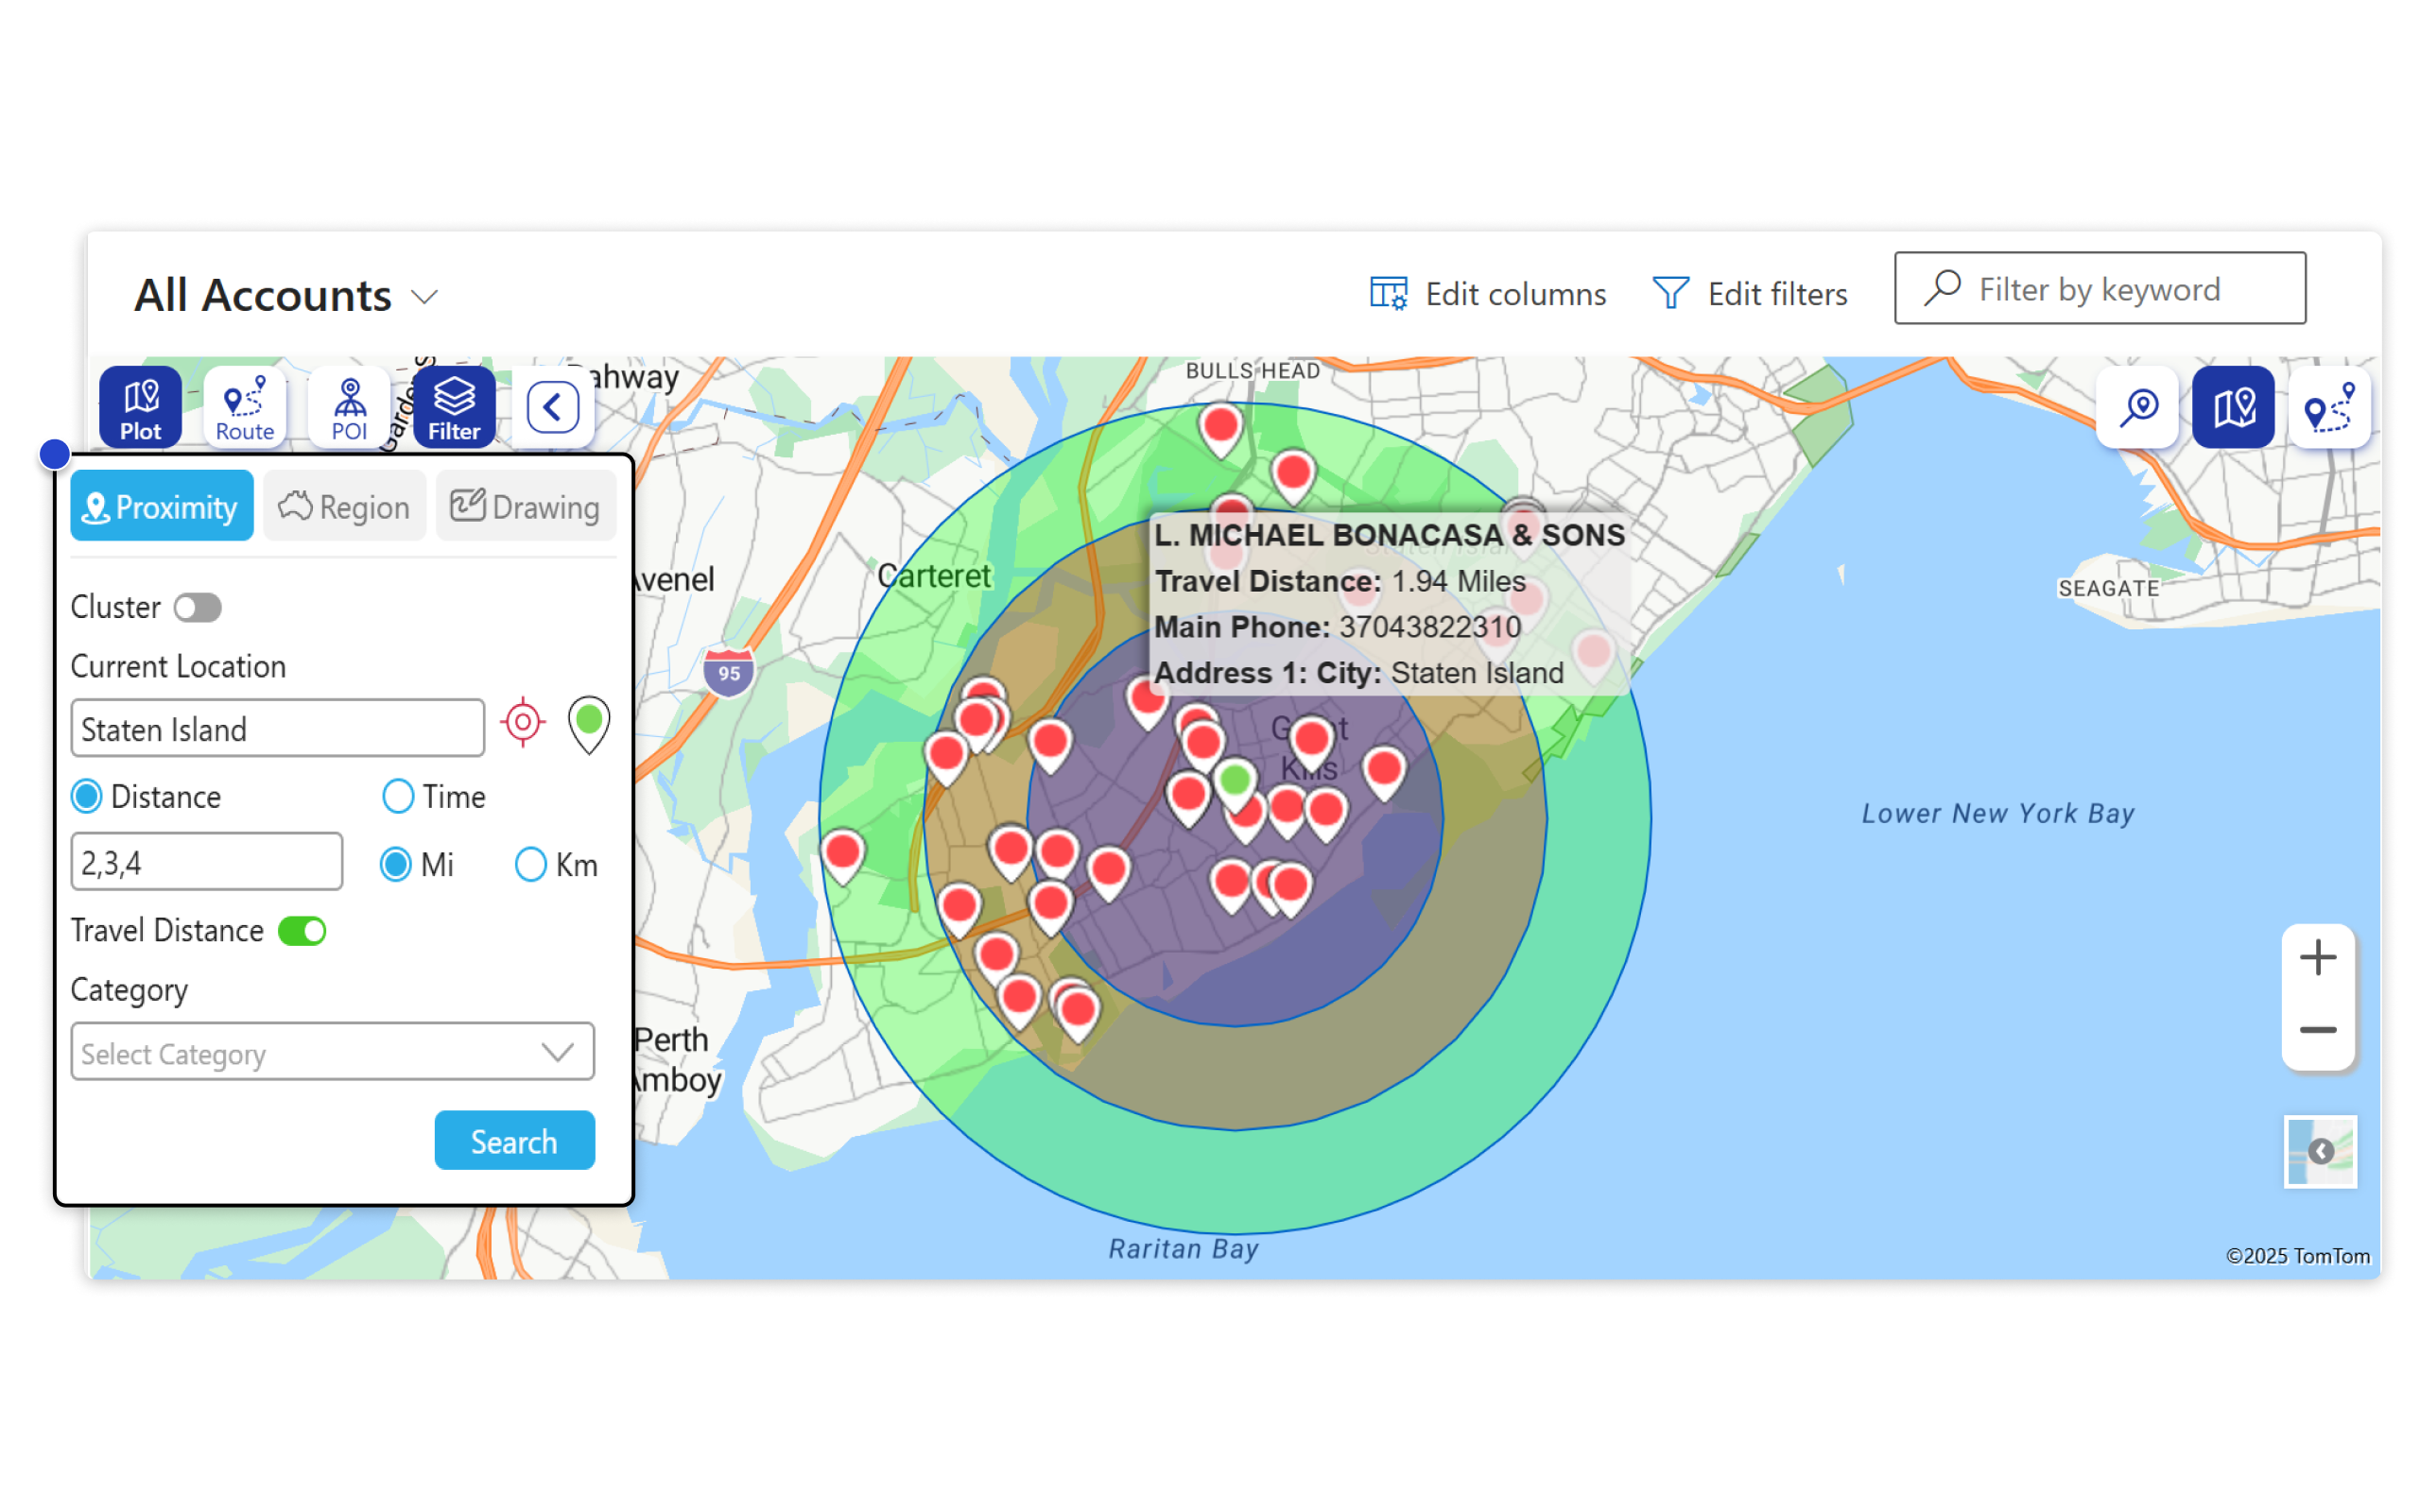
Certified geo-analytical mapping app for Dynamics 365
-- Hear About Us -- Website AppSource Partner Reference Newsletter Exhibition Social Media Others
Radius search allows filtering records within a given Proximity/Radius around current location. Users can locate nearby customers on a map based on time/travel and view the shortest travel distance along with line of sight distance using this feature. Also, users can perform concentric proximity searches from the current location for relative analysis of Dynamics CRM data.
Find optimized routes to visit customer locations with the help of Maplytics. Users will be able to plot routes between locations of their choice and cover all the locations in the shortest time span. To increase the efficiency, routes can be optimized on the basis of modes of transport. Users can save these optimized routes and share it with other users through email or print them for future references.
Managers and Sales Reps can now easily plot way points on the map and create optimized automated schedules for multiple field agents. Each user has a separate route color assigned. Set your default preferences for Auto Scheduling Card and plot automated plan on the map and save routes and appointments in CRM. Users will be able to keep track of the appointments along with the ability to Check-In/Check-Out for the set meetings/appointments. Even set Advanced Preferences to consider the existing meetings of field reps and automatically either reschedule those meetings or add them to their schedule.
This feature of Maplytics allows managers to create territories for Sales Reps. Territory management enables you to view shapes, regions or uploads shape/excel files that can be plotted on map to create territories. User can further align the territories to get proper distribution. Managers can even auto create the territories and save territories as drafts to rework on them later.
Unlock the locational aspect of your Dynamics 365 CRM data by getting the geo-coordinates for the address information stored in Dynamics CRM records using Geocoding process. With this, users can plot the CRM records on the map, create optimized routes to save travel time and costs, and much more.
Plot optimized routes for truck on map along with details of hazardous material carried and following routes dedicated to trucks.
Find nearby places of interest like Coffee Shops, Gas station, Restaurants, Parking by entering keywords and quickly setting up meeting at nearby POI locations.
Plot up to three categories for a single entity as a single pushpin where each category is taken into consideration and the final pushpin is a juxtaposition of all three categories.
Add custom controls on fields or grids within Dynamics CRM to view records on map on the data set or the dashboards that are shipped along with the solution.
Use Bing Maps License free of cost shipped along with the solution or enter your own Bing Maps Key.
Plot Census Data on map to visualize Housing units, Area land, Area water, Population Demographics, and others to make informed decisions.
Follow routes on map with turn-by-turn navigation using Waze App and Google Maps with live traffic updates and quick re-routing in case any waypoint is rescheduled.
For custom business needs, visualize records with deeper insights with multiple territories plotted with common records.
Deploy Maplytics on Power Apps with Support for CDS without any compromise on quality and security with brilliant UX and UI.
Bring your own icons for pushpins for personalized view. Also, customize the proportion of view data grid visible on map for quicker analysis.
Define the ranges for category attributes and select the color & shape of pushpins. Change the heat map color scale as per the preference for easy analysis on the map.
Maplytics offers the ability to personalize the app based on your preference on user and organization level in Dynamics CRM and therefore offer seamless mapping services.
Stay mobile and visualize your Dynamics CRM data on Android, iOS, and Windows, Mobiles and Tablets.
Maplytics currently supports English, Spanish, German, French, Portuguese, Turkish & Arabic languages.
Perform drill-down analysis of a particular record by plotting its related (child) records on the map and study their relationships.
Create Localized Marketing Campaigns and boost conversions by building a targeted marketing list that can be approached to generate leads and sales.
Save time by saving search criteria like data source, category, search parameters and more as a template and plot them directly whenever necessary.
Get a better understanding of market geography to spot patterns and identify trends by using Pie charts and Column charts in Heat maps for complex data analysis.
Get an insightful overview of Dynamics 365 data with Analytical Dashboards on a map that gives a summary of the data plotted on map.
Thank you for your submission.