Goals were introduced as an accelerator the first time around way back in CRM 4 or CRM 2011 days and it continued to be included as a part of the Sales offering within Dynamics 365 CRM till date with little to no update to this feature over the years. Honestly this was one area on the sitemap I never bothered to click all these years.
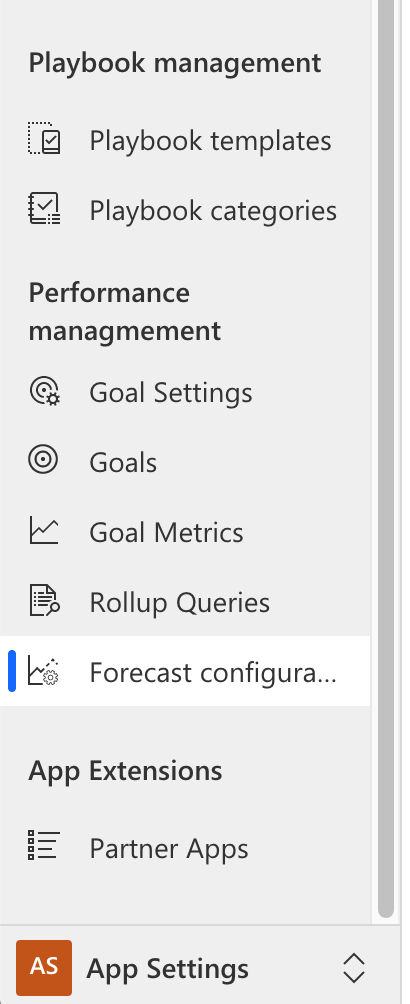
And today I see Forecasts, in the same Goals area, well the Goal section gets a new flashy title too ‘Performance Management’.
I did have to read through the documentation to understand how this works, but it follows the same concept as the Goals feature. You set Targets/Goals for the period and evaluate performance against the set Targets.
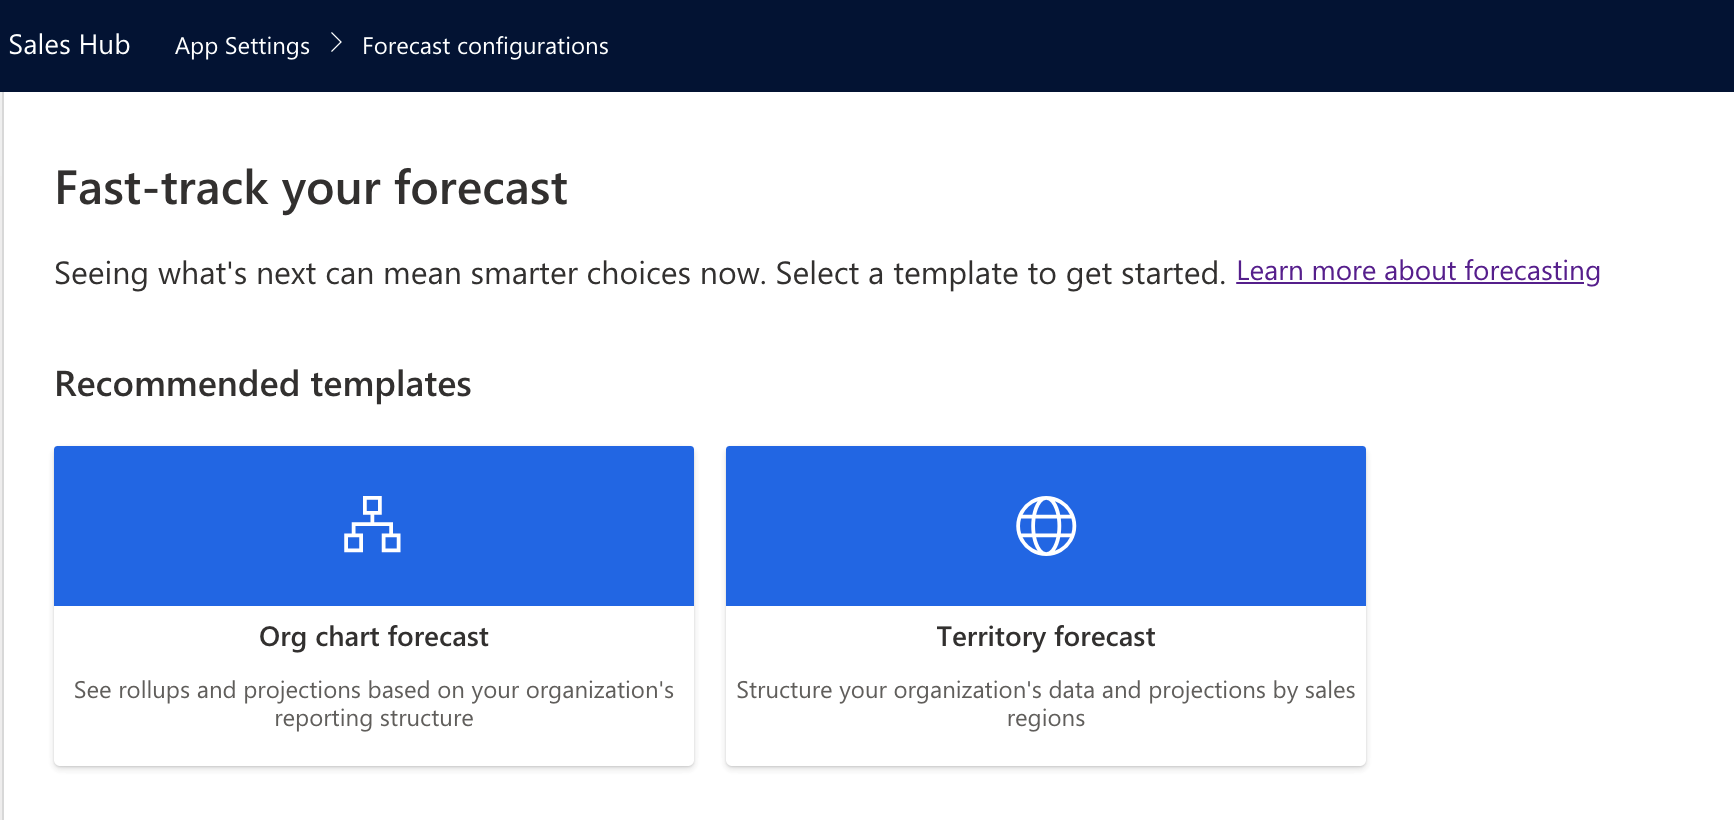
Forecast for both configuration and evaluating the results is now available in a more visual format compared to the record-based design of the earlier feature.
Forecasting understands that targets are assigned and evaluated either based on teams and user hierarchy or regional and territory based. These are the two types of forecasts that is allowed to be defined as at the time of writing this article.
Looks to be a very limited version for now as this currently only supports Opportunity entity which is also the most common entity for forecasting.
Org Chart Forecast
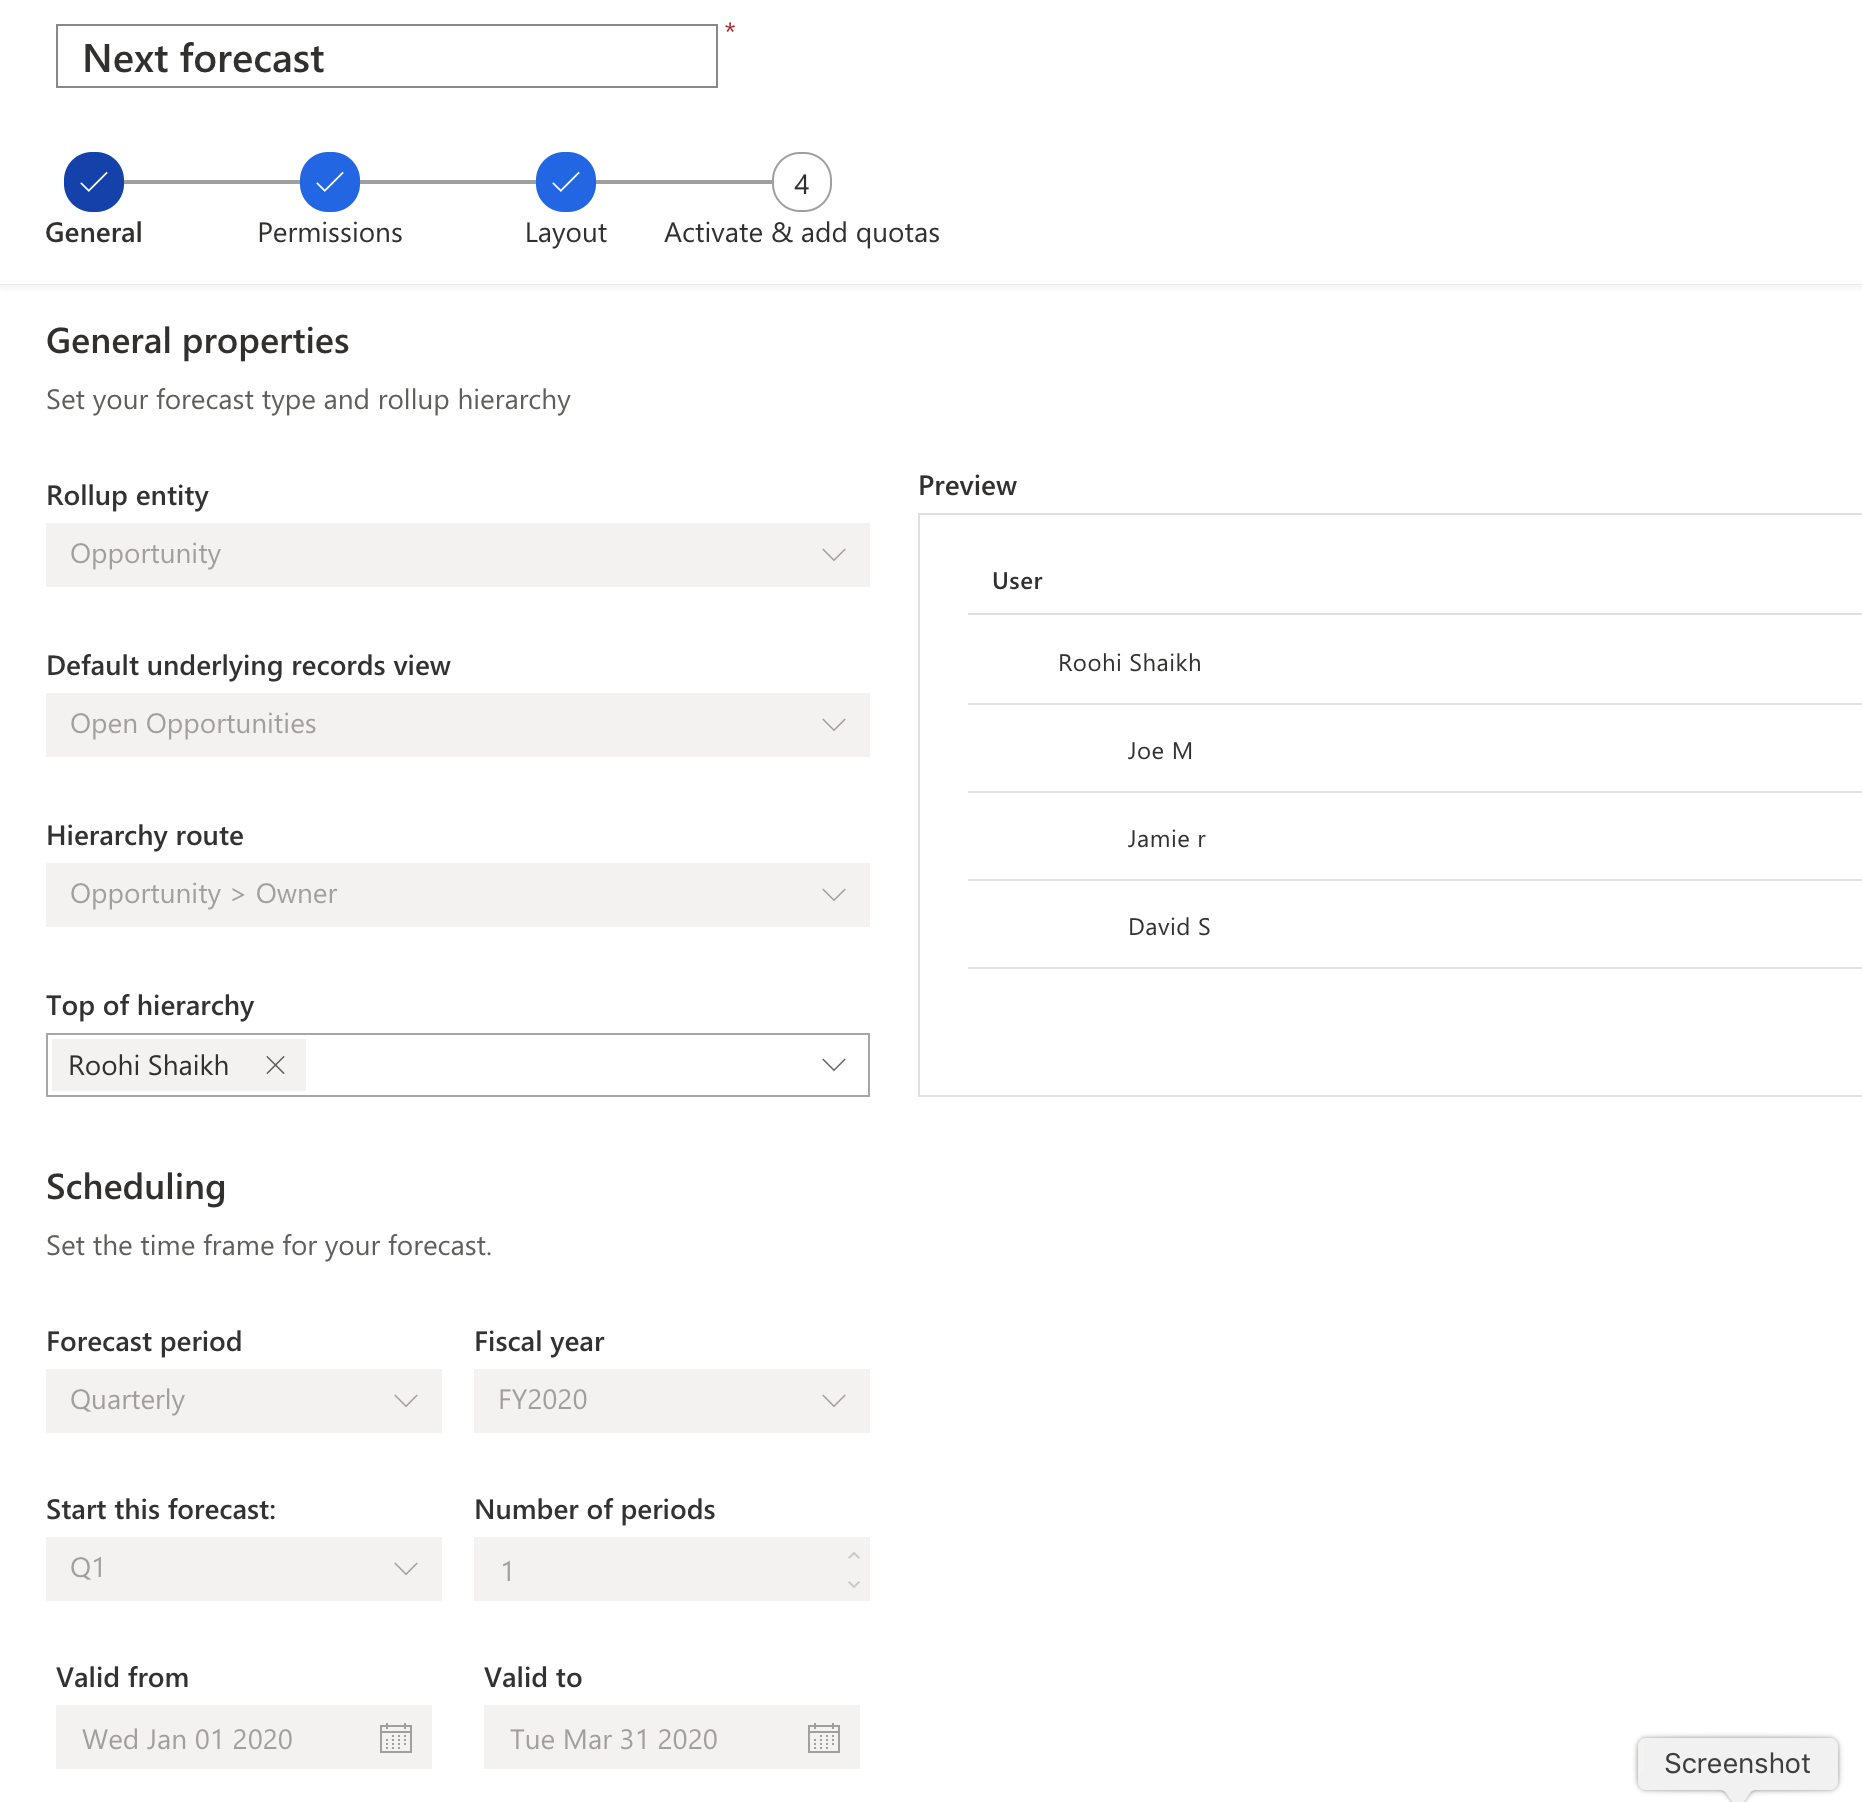
In this you choose the users at the top of the hierarchy. Using the Manager lookup on the user entity, the entire hierarchy of users is auto selected.
Territory Forecast
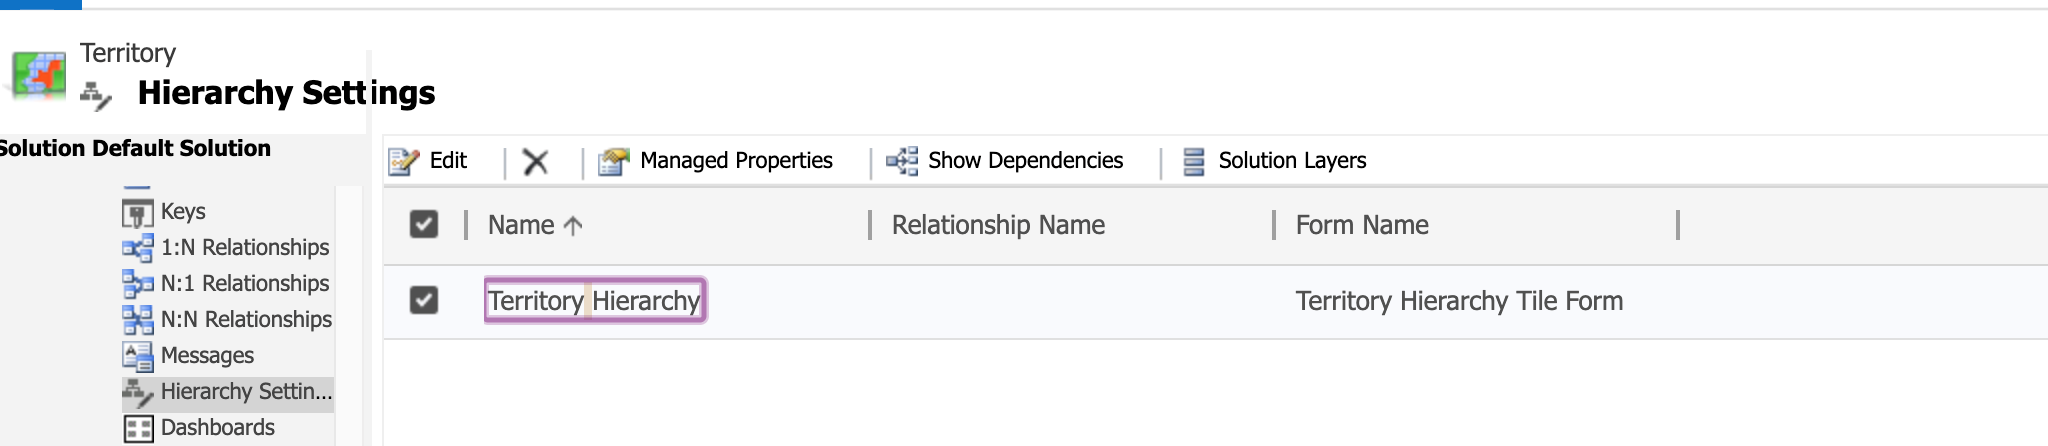
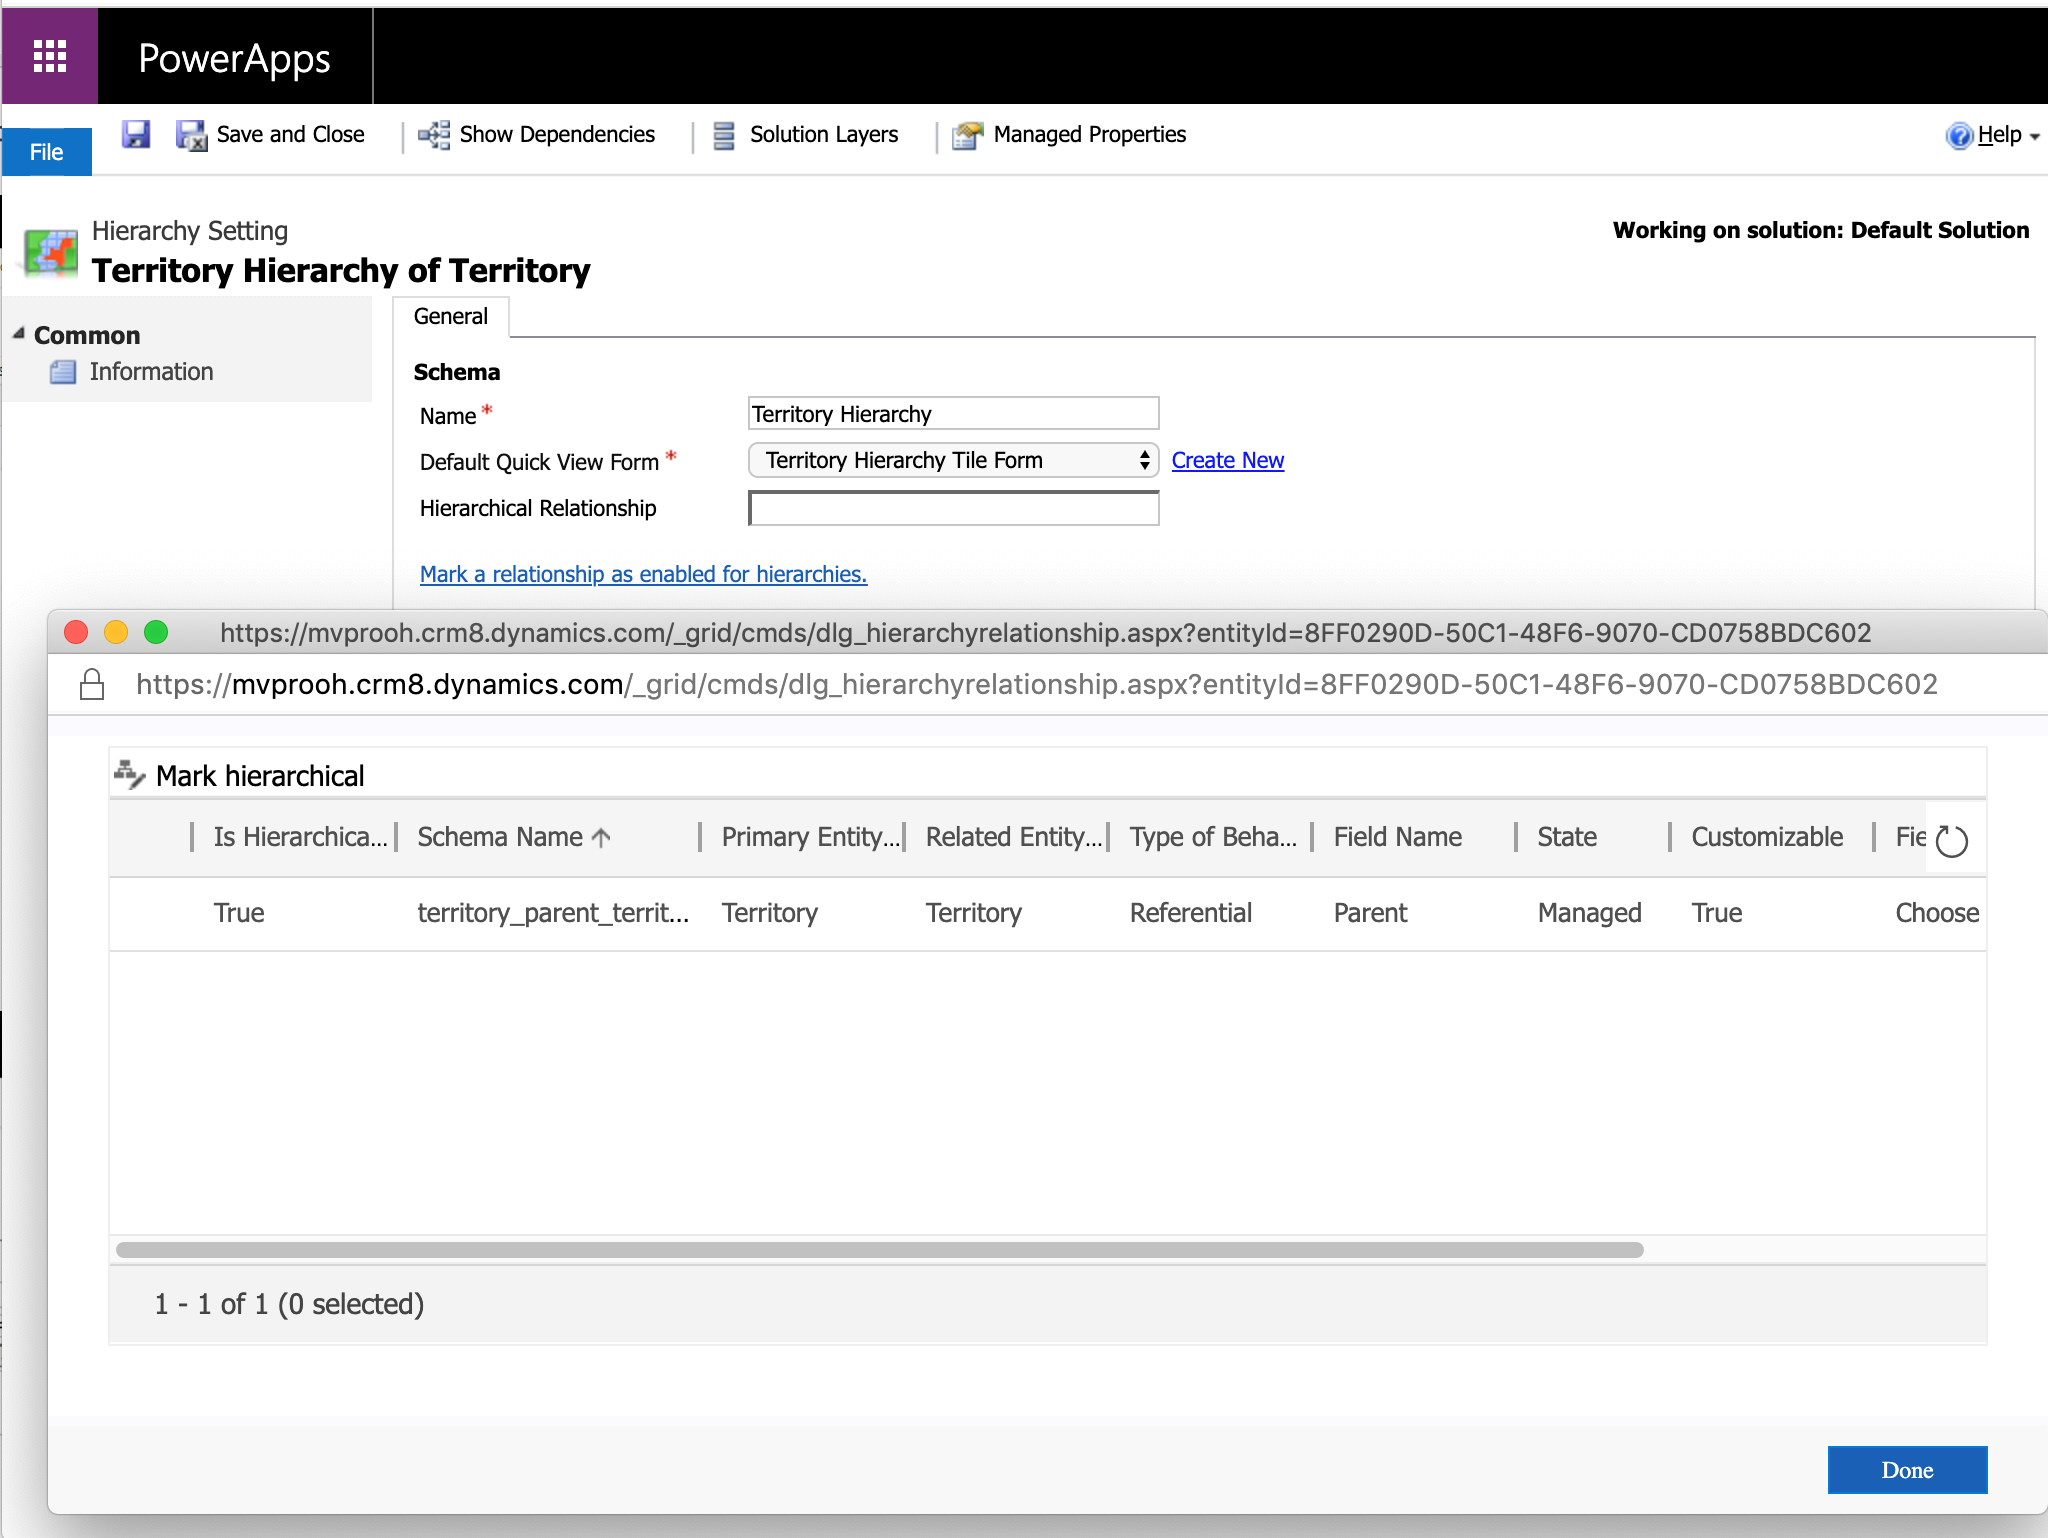
Make sure to enable Territory hierarchy before you create a forecast using this template. Customize the Territory entity à Choose the hierarchy defined in the hierarchy settings.
Edit the setting to bring up the following form.
Click on the hyperlink to Make a relationship enabled for hierarchies.
With that done, selecting the Territory Forecast will bring up the following settings:
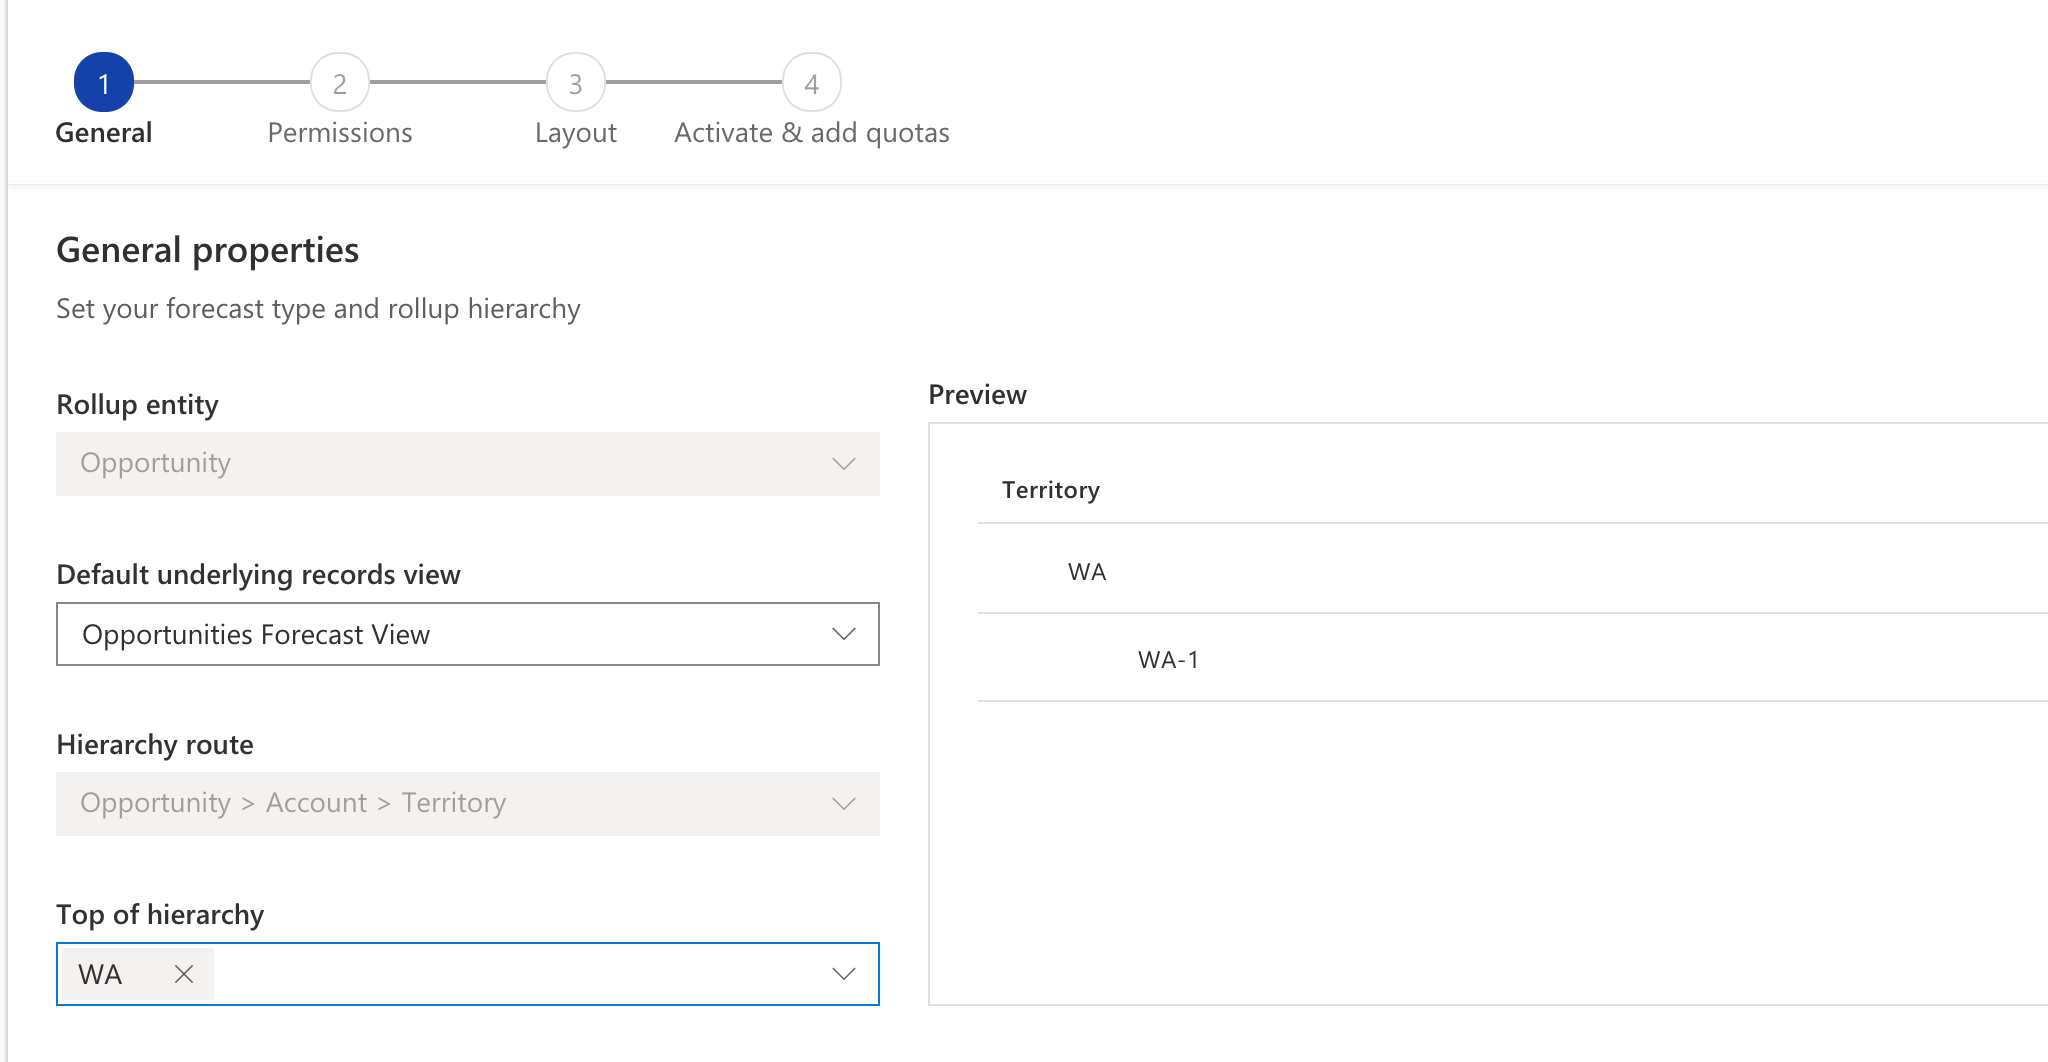
Choose the Territories at the top of the hierarchy in this case.
The rest of the steps remain the same for both types of Forecast.
Set the time period, it could be monthly or quarterly.
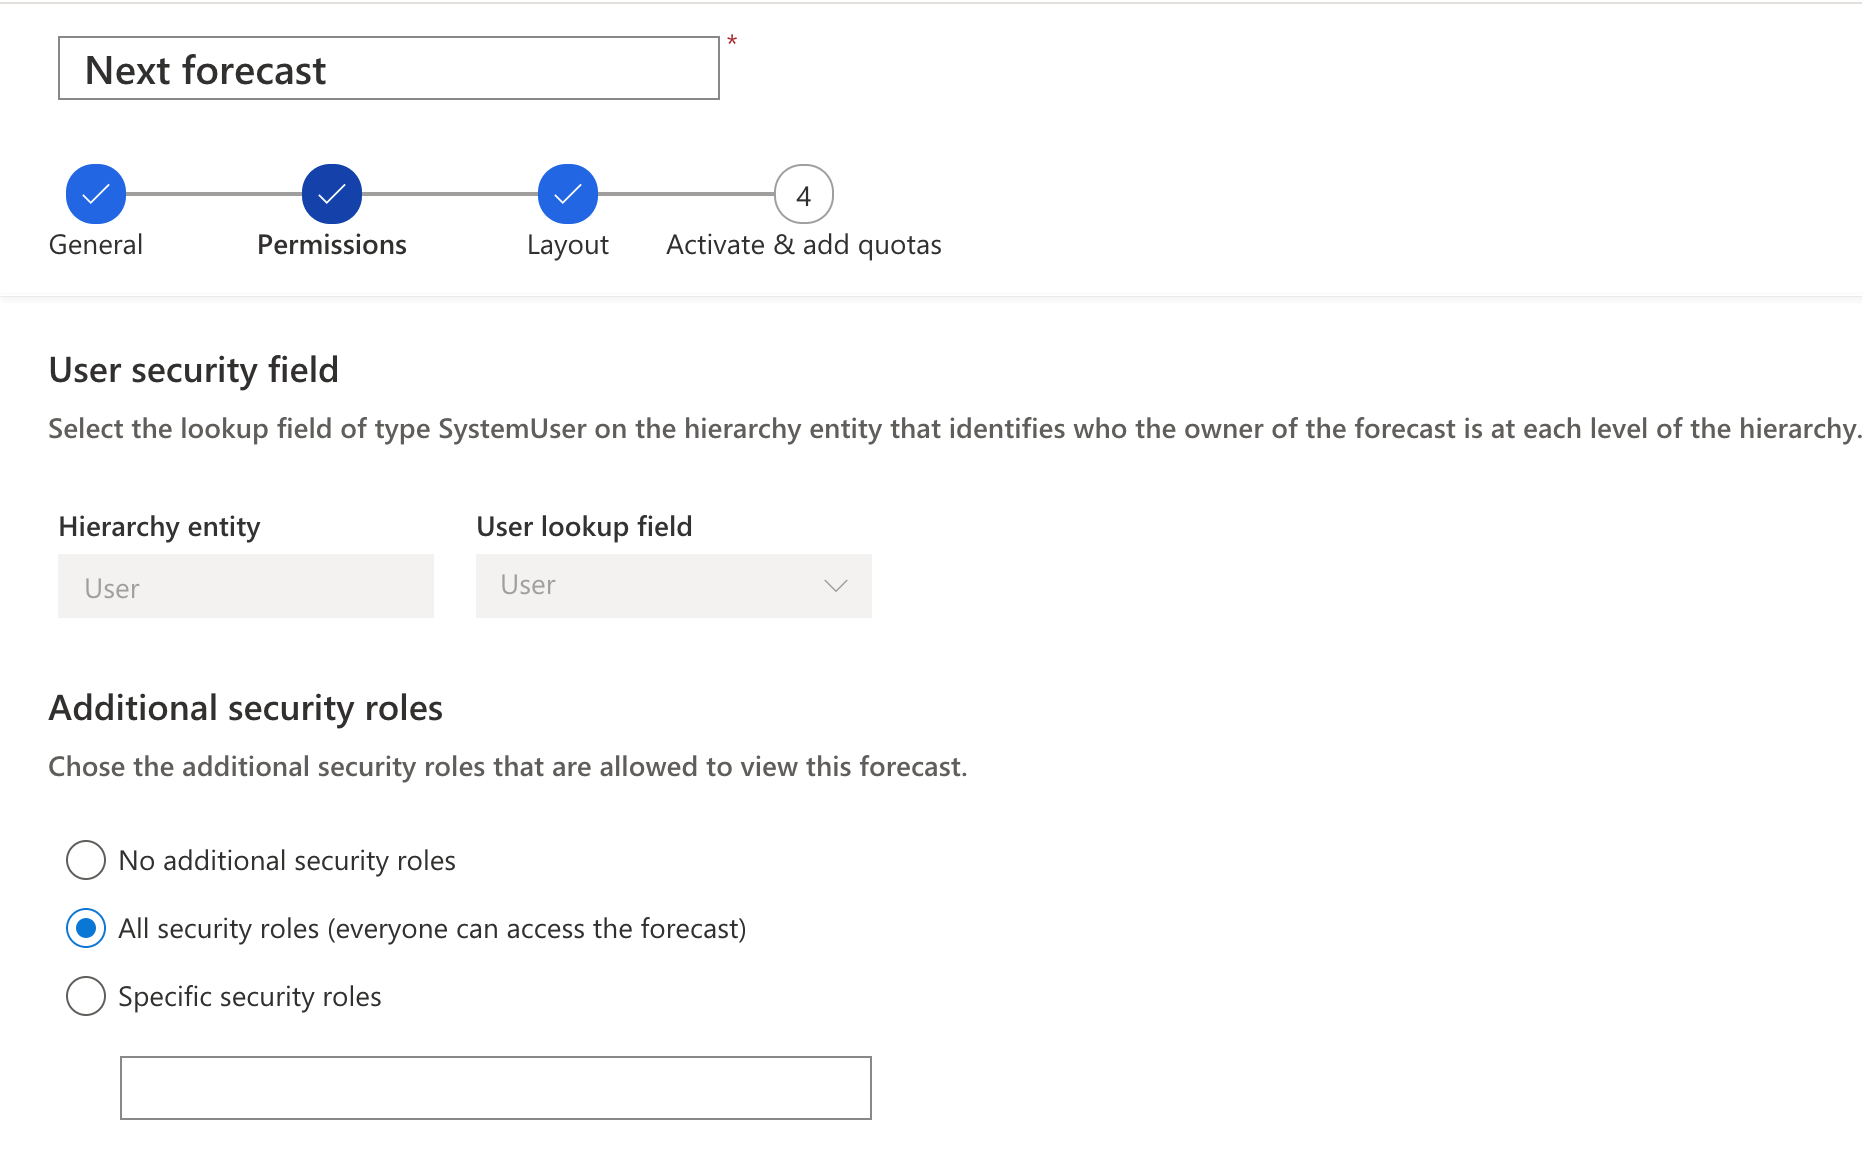
As you proceed, the next step is to choose the security roles that are allowed to view the forecast.
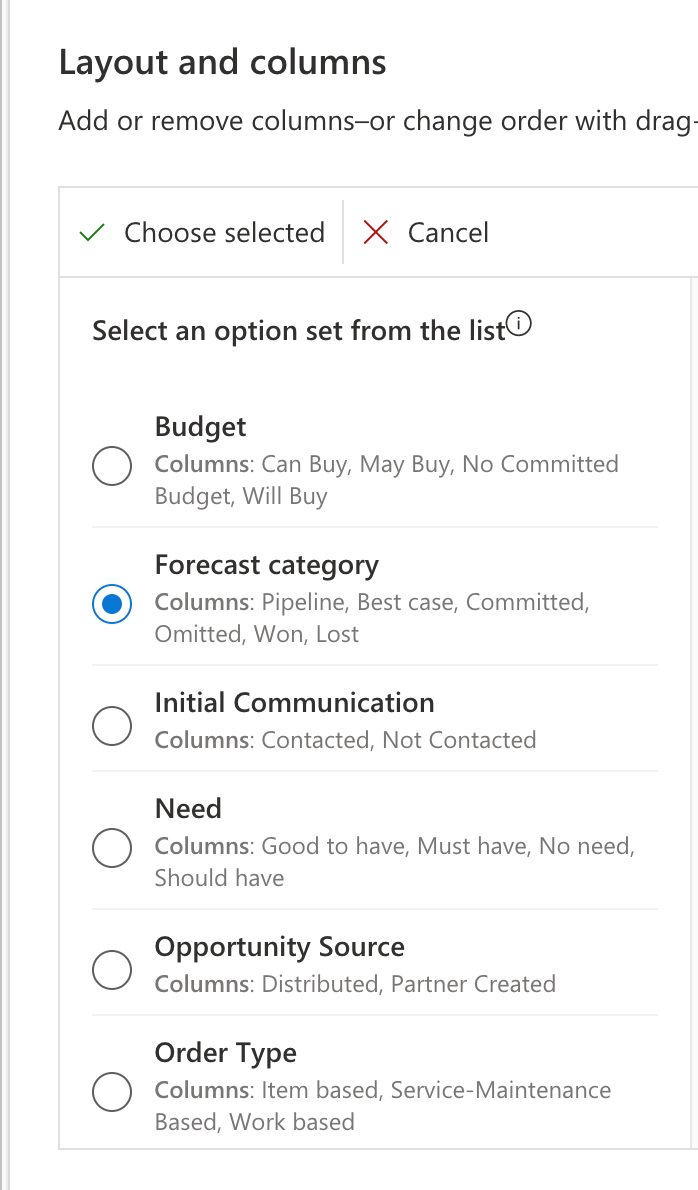
Layout Step, this got me a little confused. This is where you define the rollup fields and criteria for your forecasts.
To classify the actuals against various stage of the business process, you can select the optionset field that defines the stages.
Microsoft ships Forecast Category as a custom attribute along with predefined optionset values. I choose the same field here for simplicity. But you could choose any other optionset field of your choice.
The layout preview auto-refreshes to list out the report view for you.
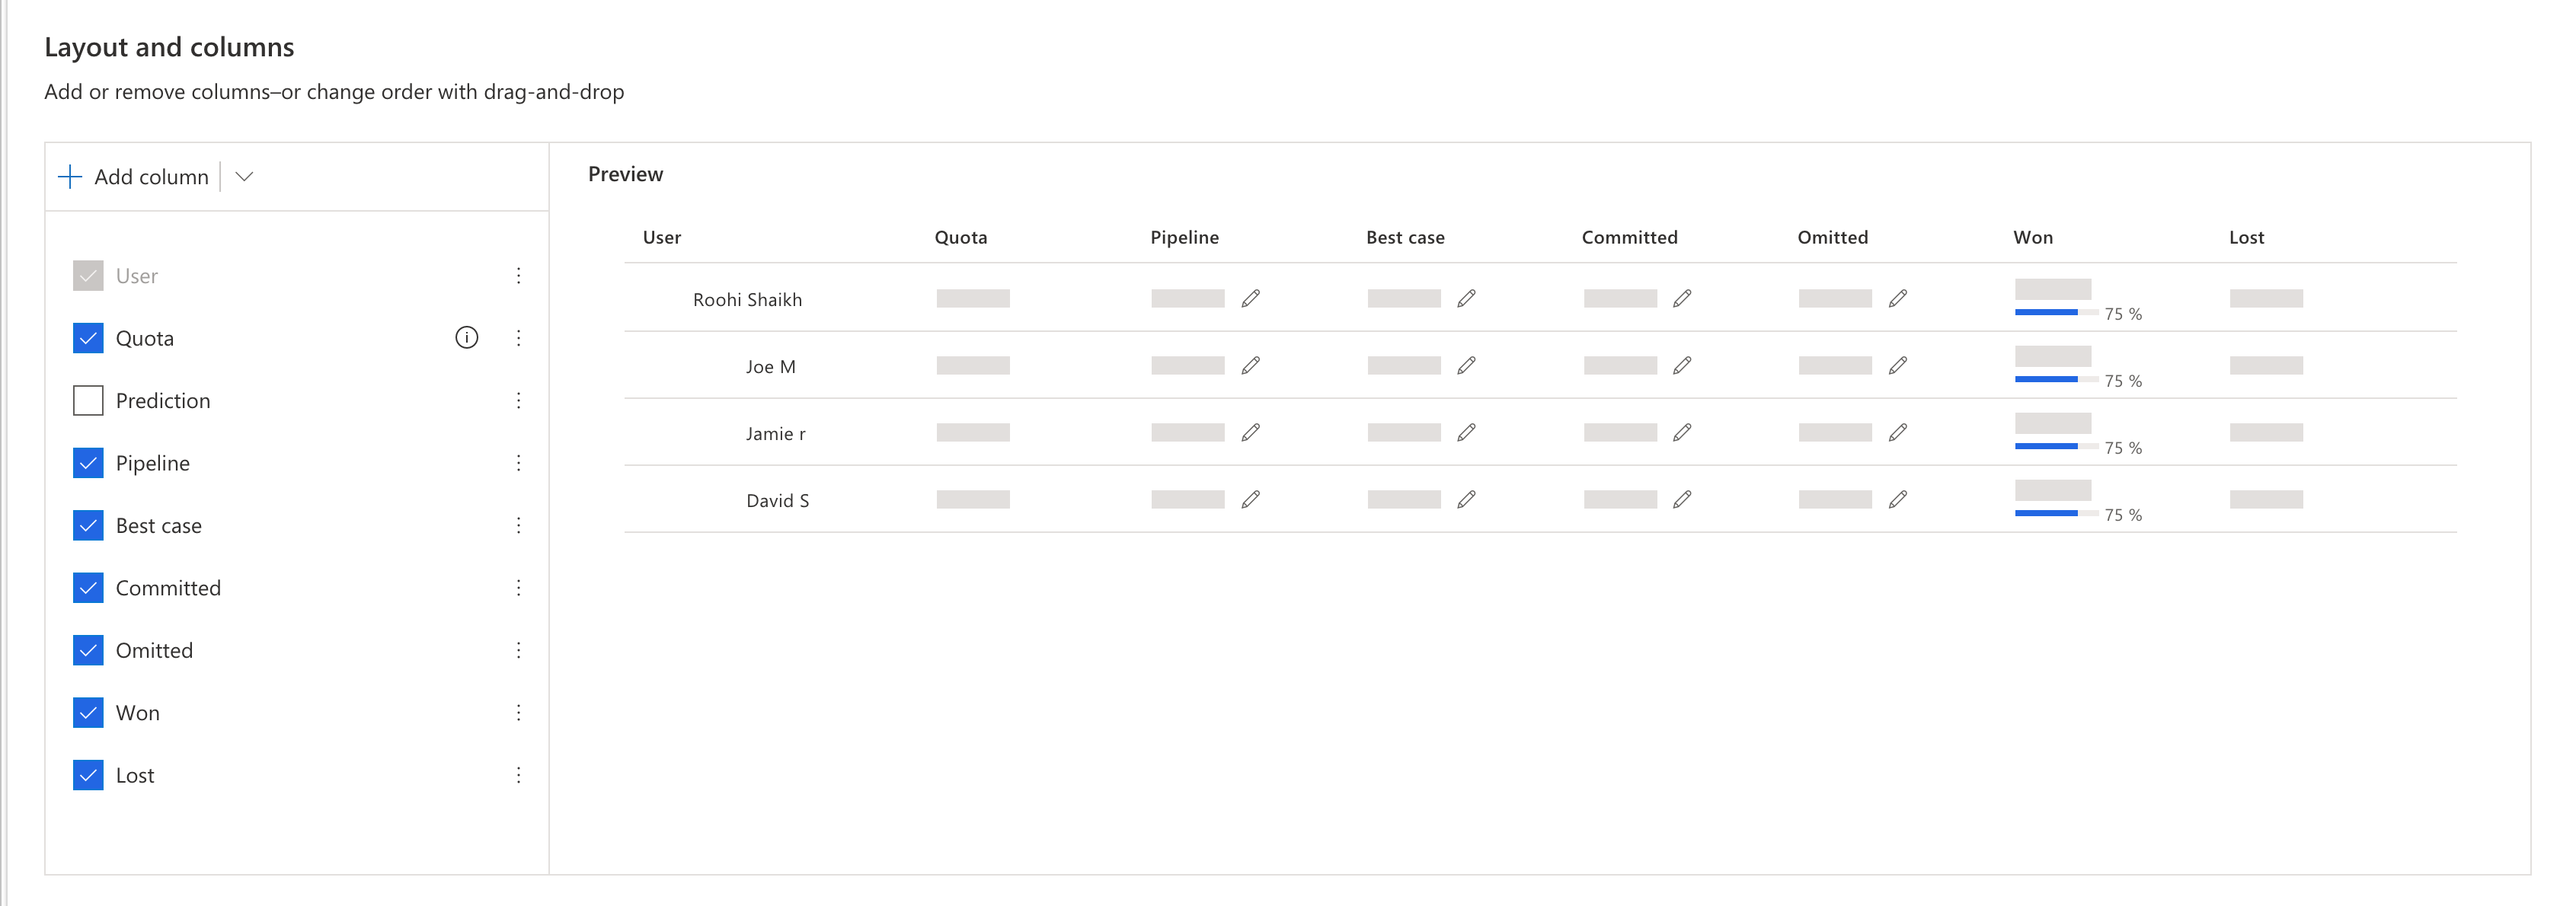
Click on the ellipsis of each of the columns added to configure the rollup definition for the column.
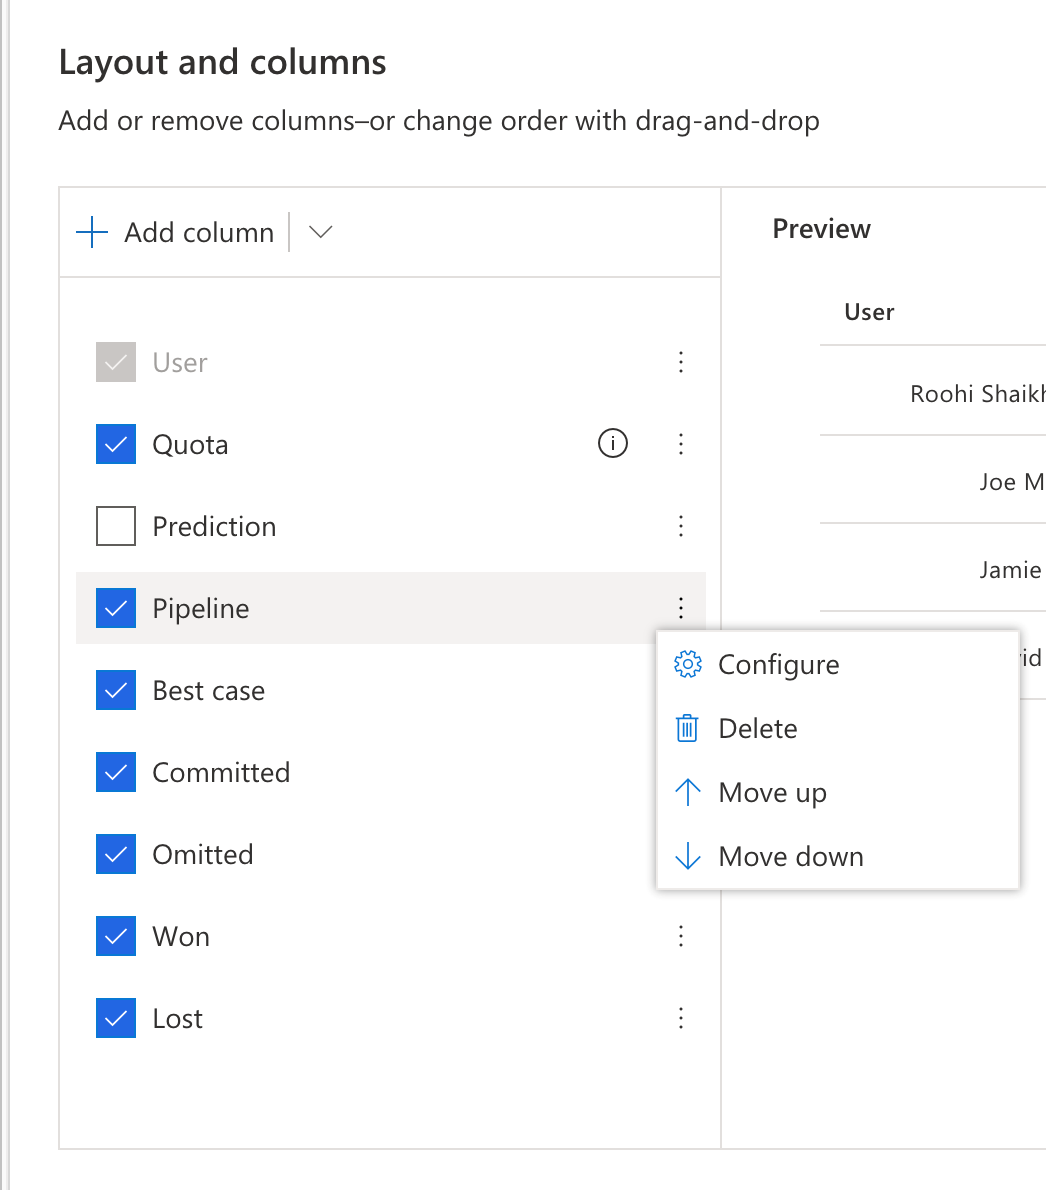
And these are the important properties of each column.
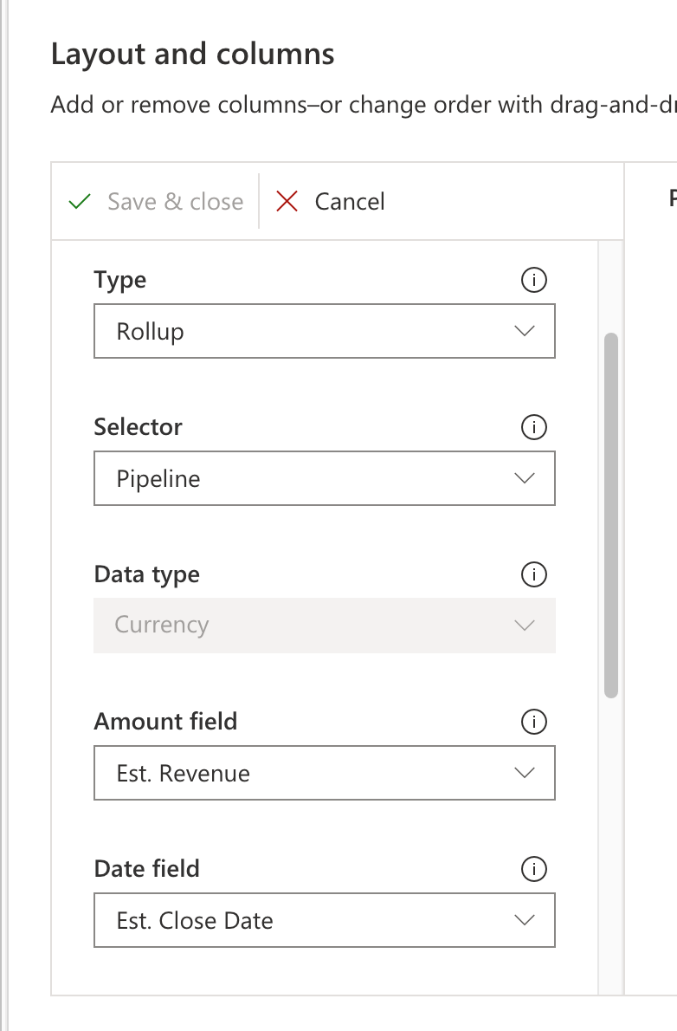
Rollup the value of Est. Revenue field where Forecast category = Pipeline and Est. Close date is within the forecast period defined in the first step.
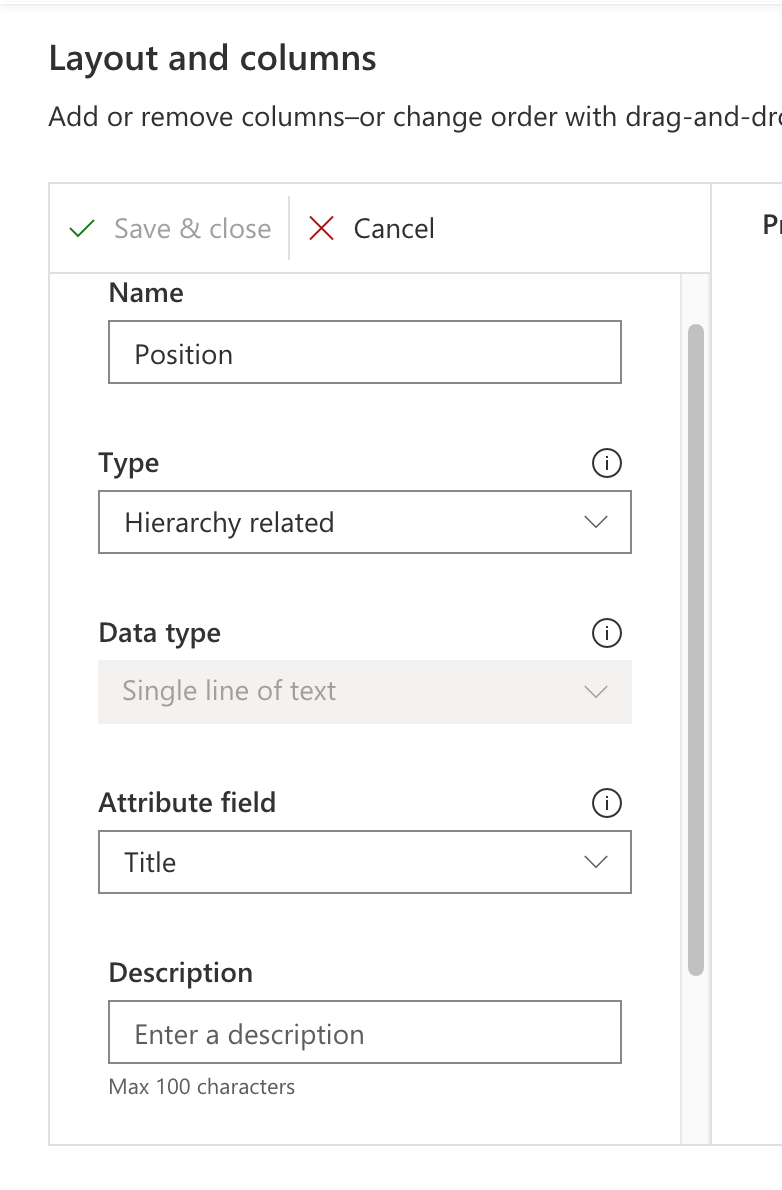
The layout designer also has the ability to add custom columns choosing the Add Column option.
Below I have configured a new column to include the title of each of the users in the report.
Choosing the type as ‘Hierarchy related’ allows you to select the fields from the hierarchy entity, in case of org chart type of Forecast it is User.
In the final set, we activate the forecast and then you have the ability to upload an excel file with the forecast targets for the users.
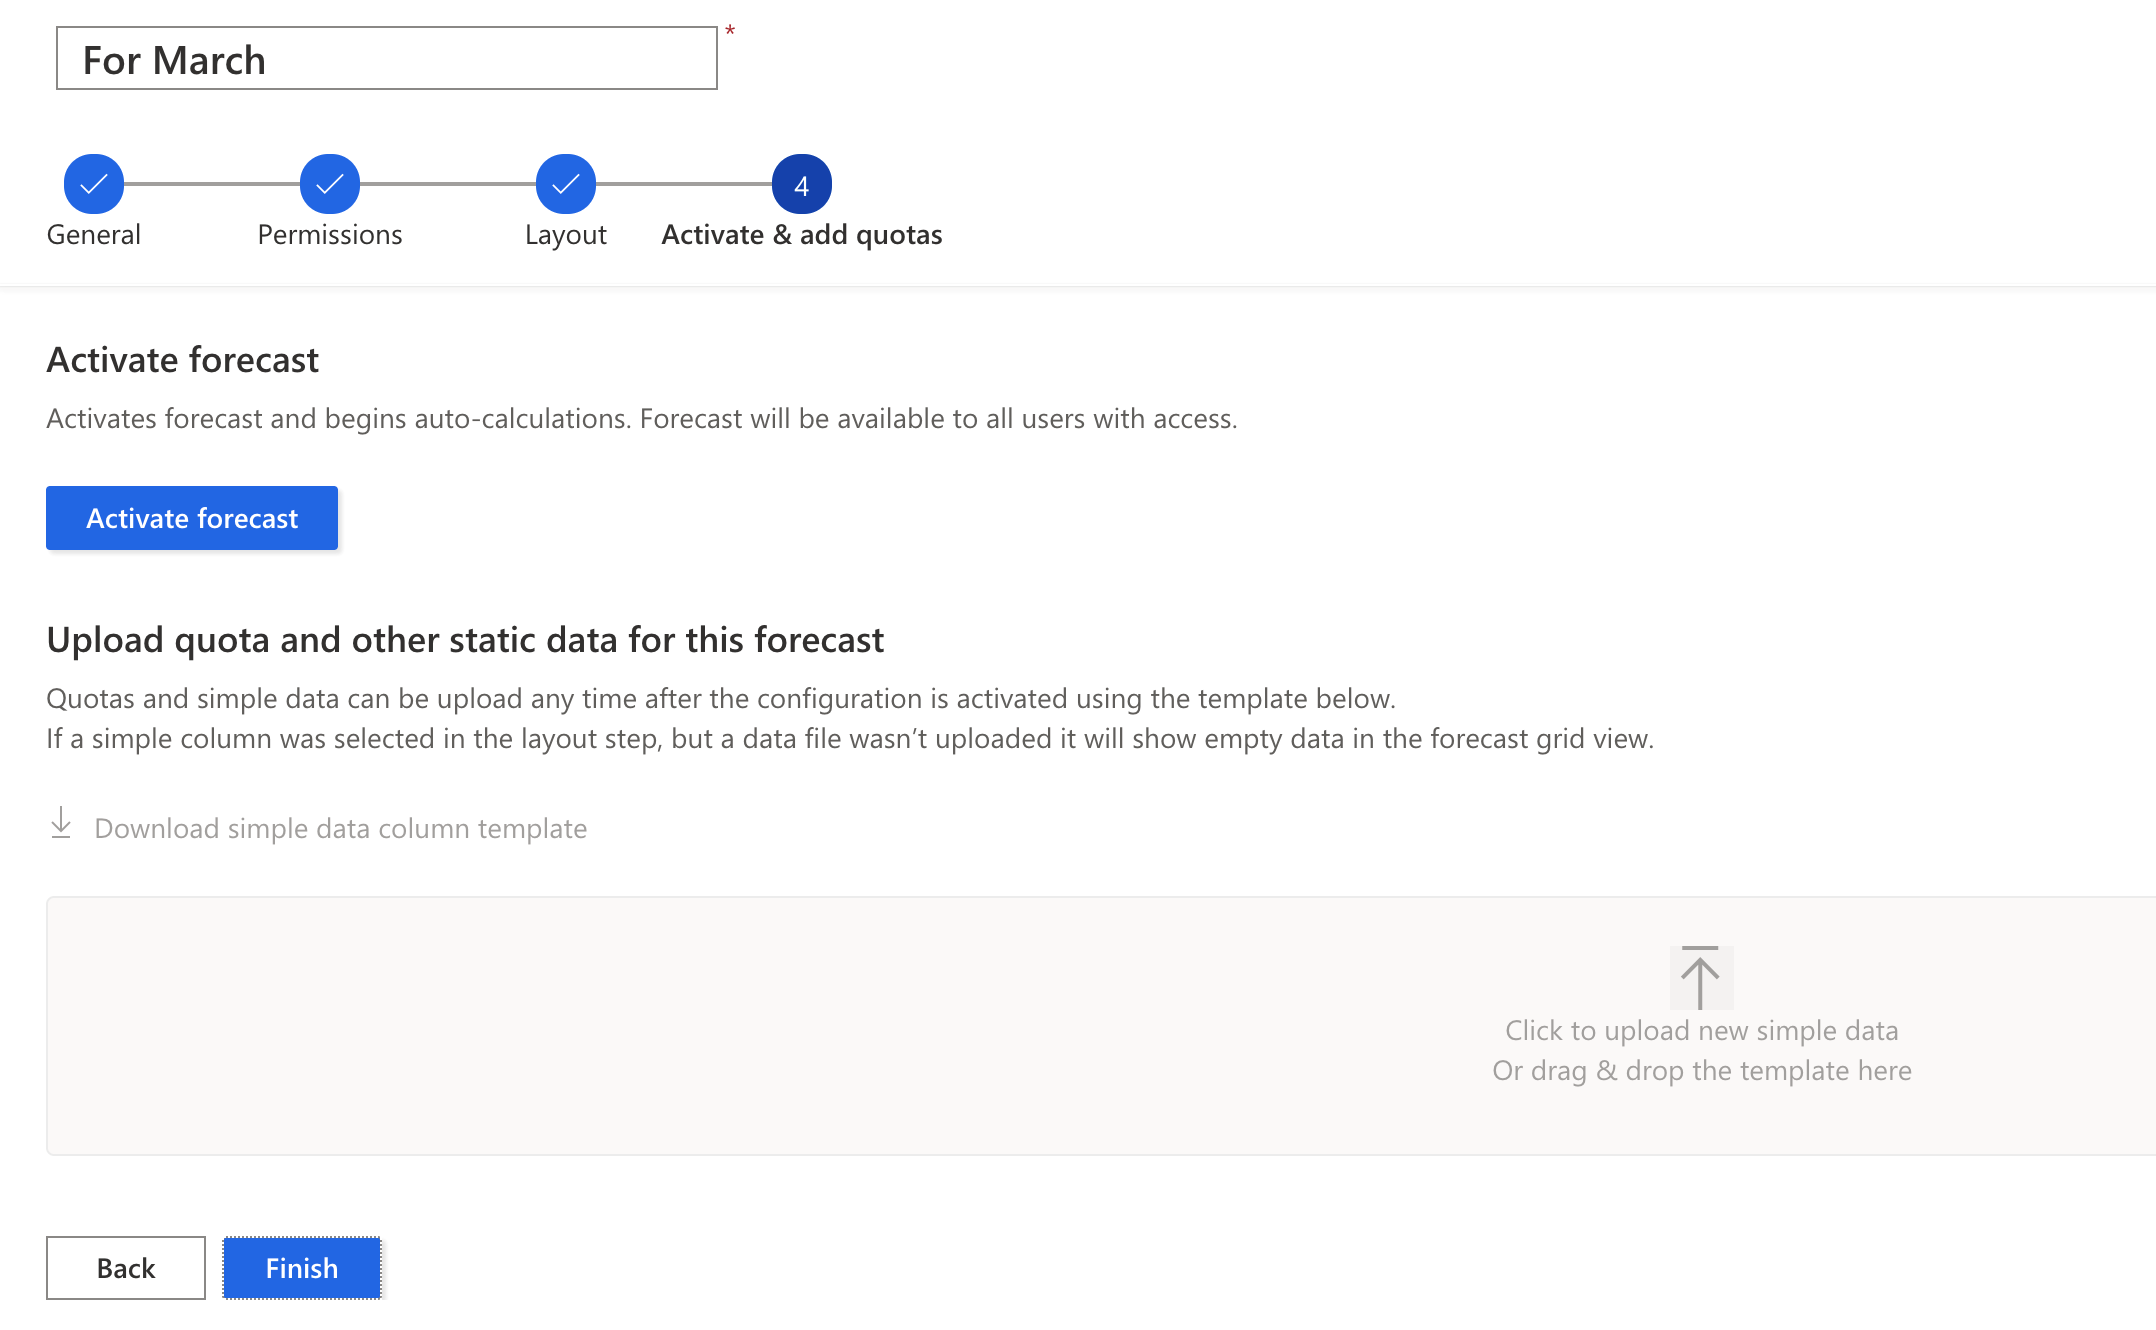
Do make sure to complete the configuration in the previous steps before you activate the forecast. While it allows you to de-activate the forecast and the edit forecast option is also available, all the layout columns are disabled, so you cannot really make any edits to the forecast other than upload revised targets from this tab.
To upload the targets, first download the template. The template will include columns for all the users selected in the previous steps for whom the targets need to be defined.
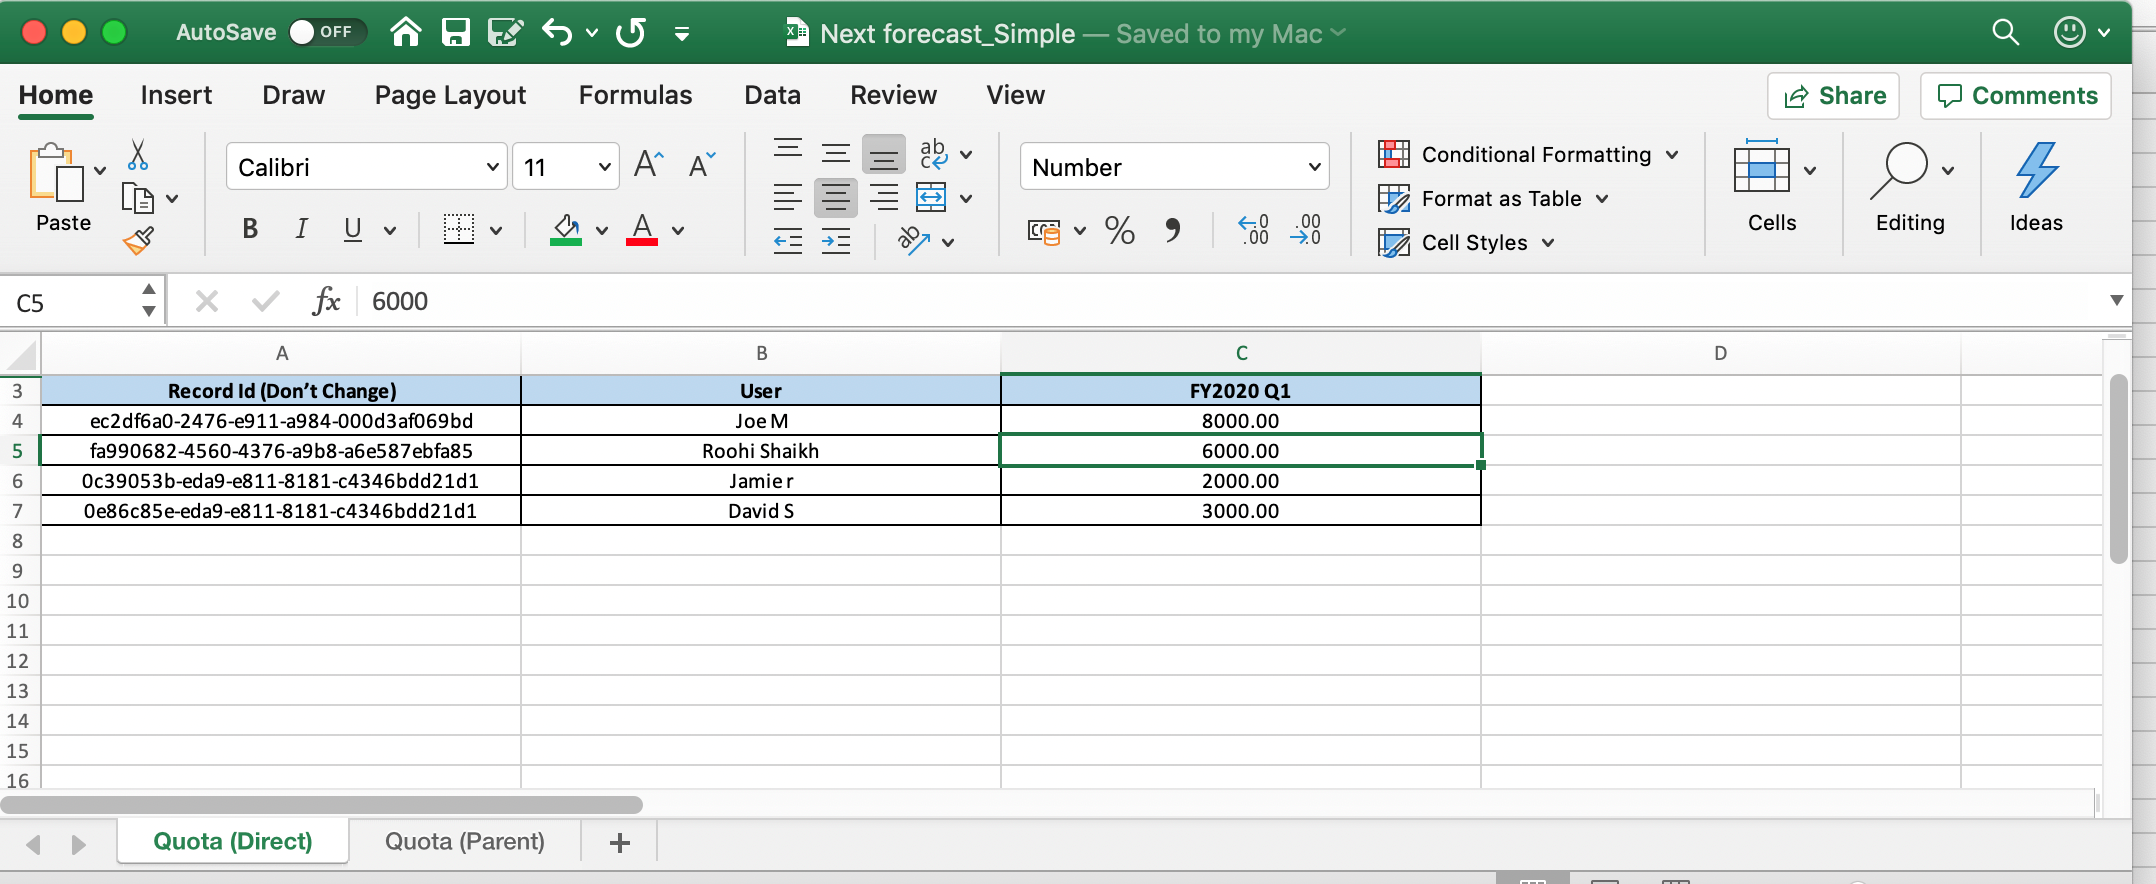
The first tab includes the quota for each individual user. In the second tab you can set the target for the top-level records, in this case users.
With this you are all set to use the new Forecasting feature.
The Forecast report/visualization needs to be added manually to the sitemap. Add a sub-area to the site map that points to the following URL:
/main.aspx?pagetype=control&controlName=ForecastingControls.FieldControls.ForecastGridPage
And voila, here you are;
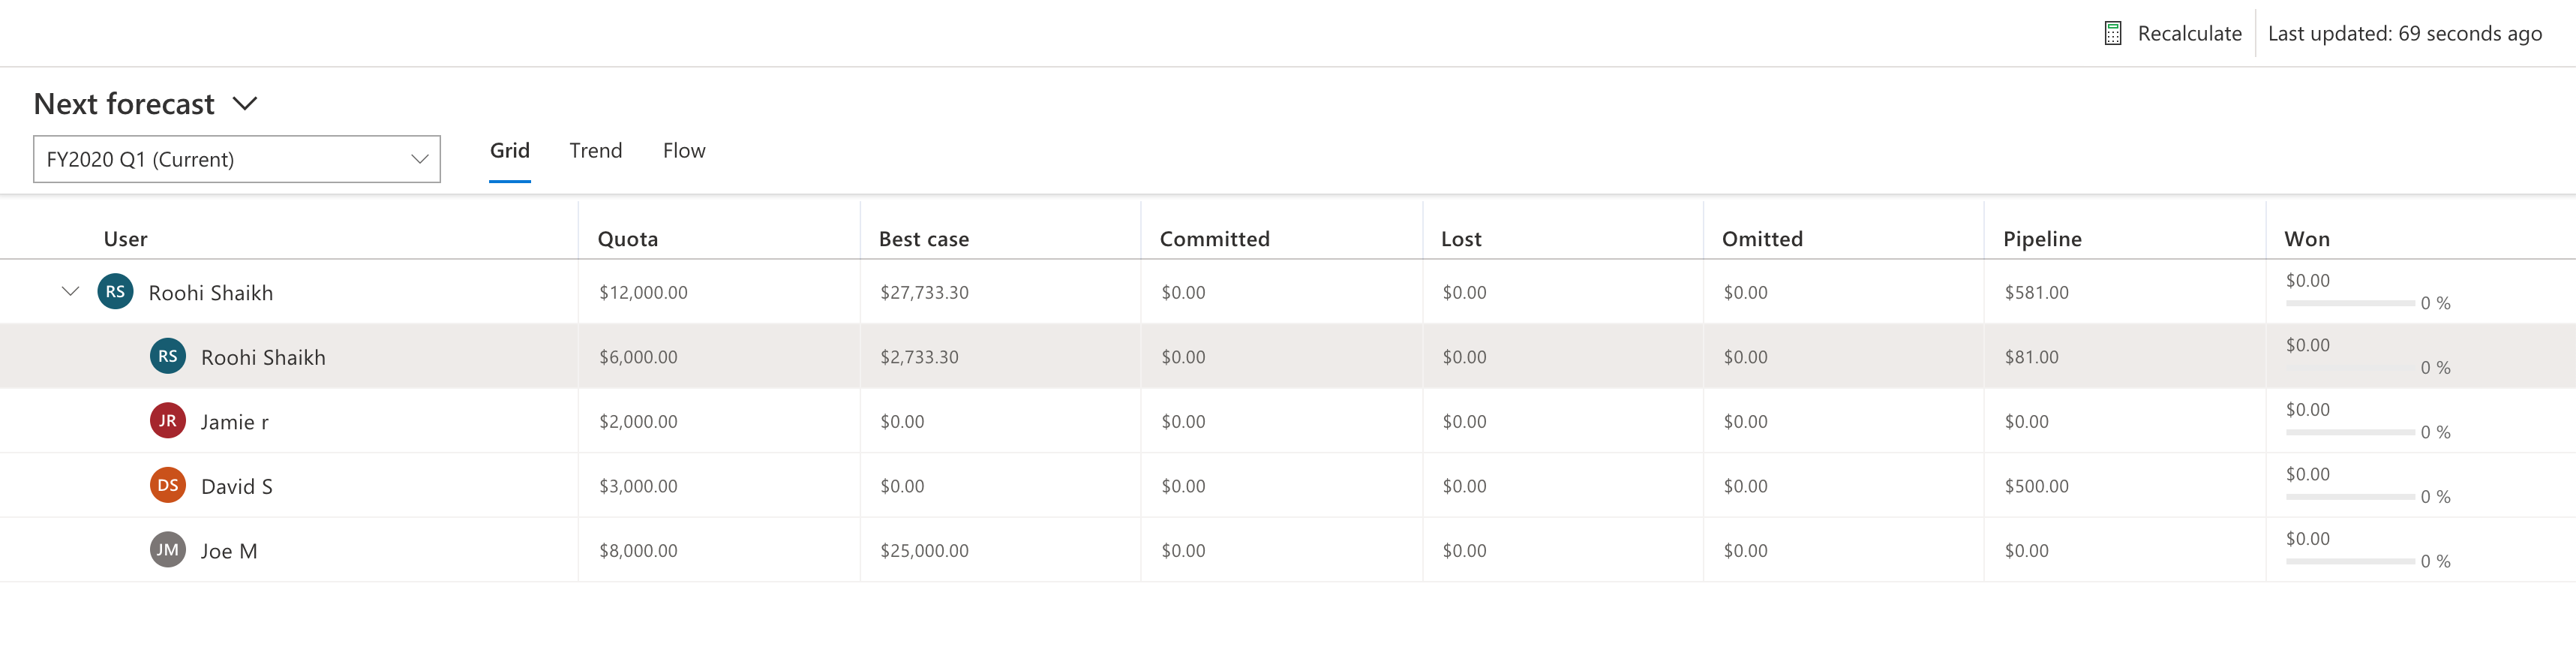
Use the Recalculate button at the top right for on-demand recalculation for the latest values.
I couldn’t get the Trend and Flow tab to work.
Now the same could be visualized using the KANBAN control to get the details of the opportunities in each of these forecast stages for each of the users.
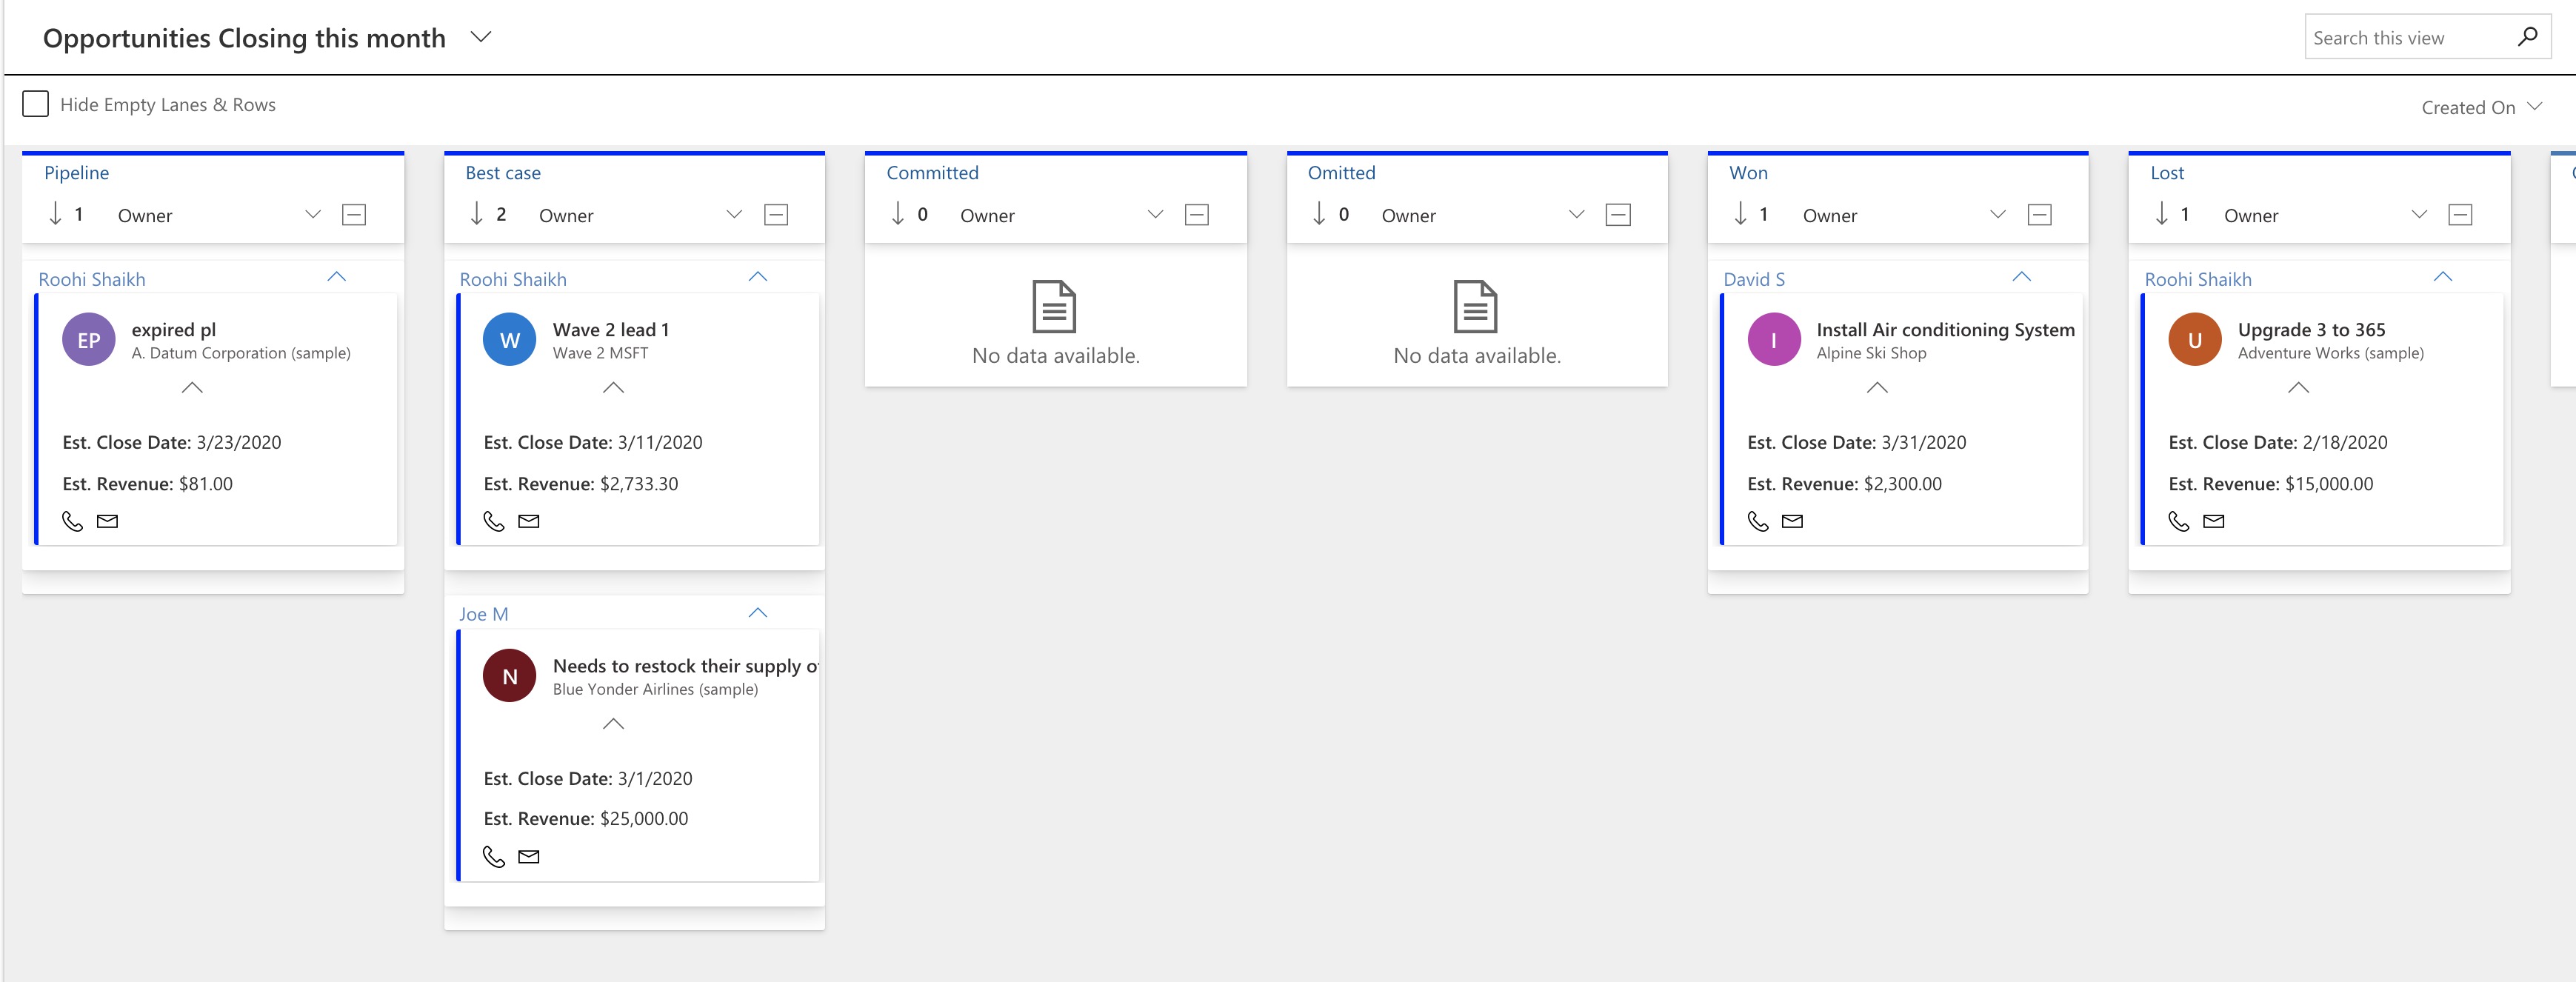
You can download this Kanban control for your datasets from here.