Let’s face it – Visualization is the best way to interpret data easily. Even for experts, data needs to be displayed in a suitable form for analysis, to draw out comparisons and trends. With the huge amount of data in Dynamics 365 CRM/Power Apps, you may find it difficult to draw out conclusions from the given data.
But what if you can visualize your Dynamics 365 CRM data? What if you can replace the old grid view with a more effective Kanban view?
Don’t you think this will help you to analyze data more easily?
Kanban Board – a Preferred App on Microsoft AppSource – is just what you need.
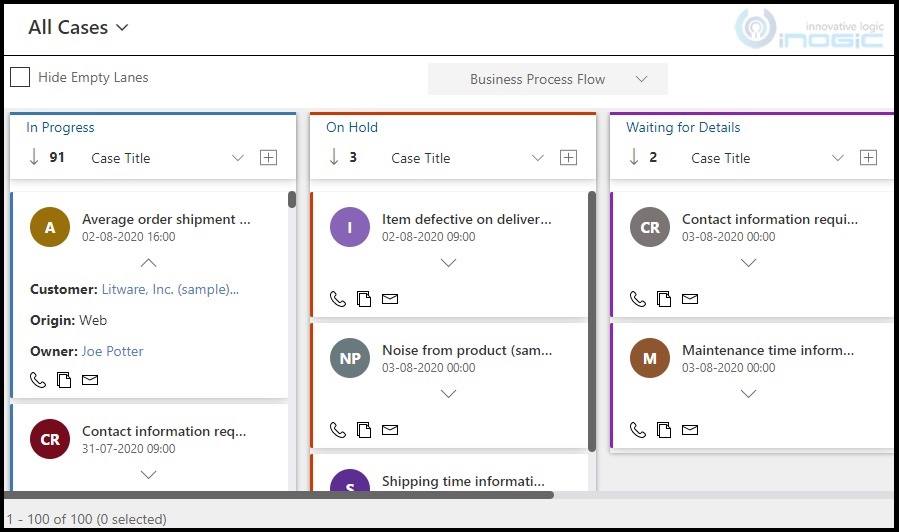
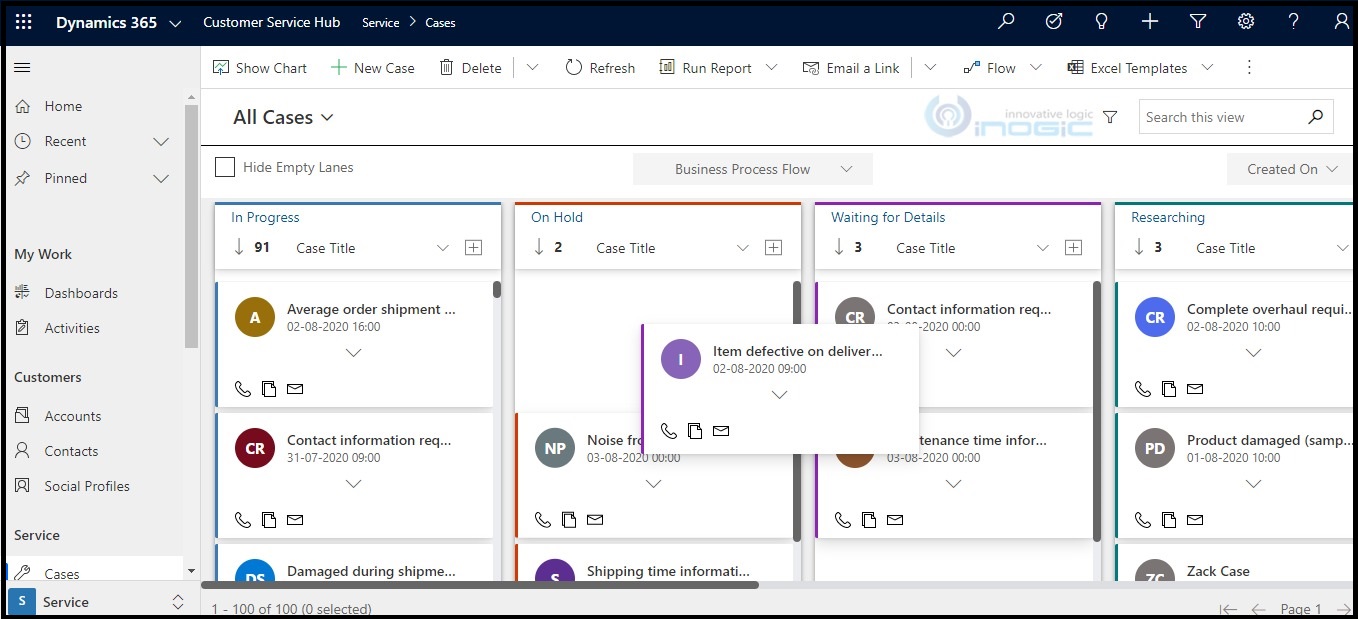
Kanban Board is a productivity app that helps you to get a Kanban View of Dynamics 365 CRM/Power Apps data. All the records are categorized and systematically arranged in compact movable cards in multiple lanes and rows for quick review and easy analysis. And this is how it will look once you configure the Kanban control for OOB or Custom entities. Here, it is configured for Case entity.
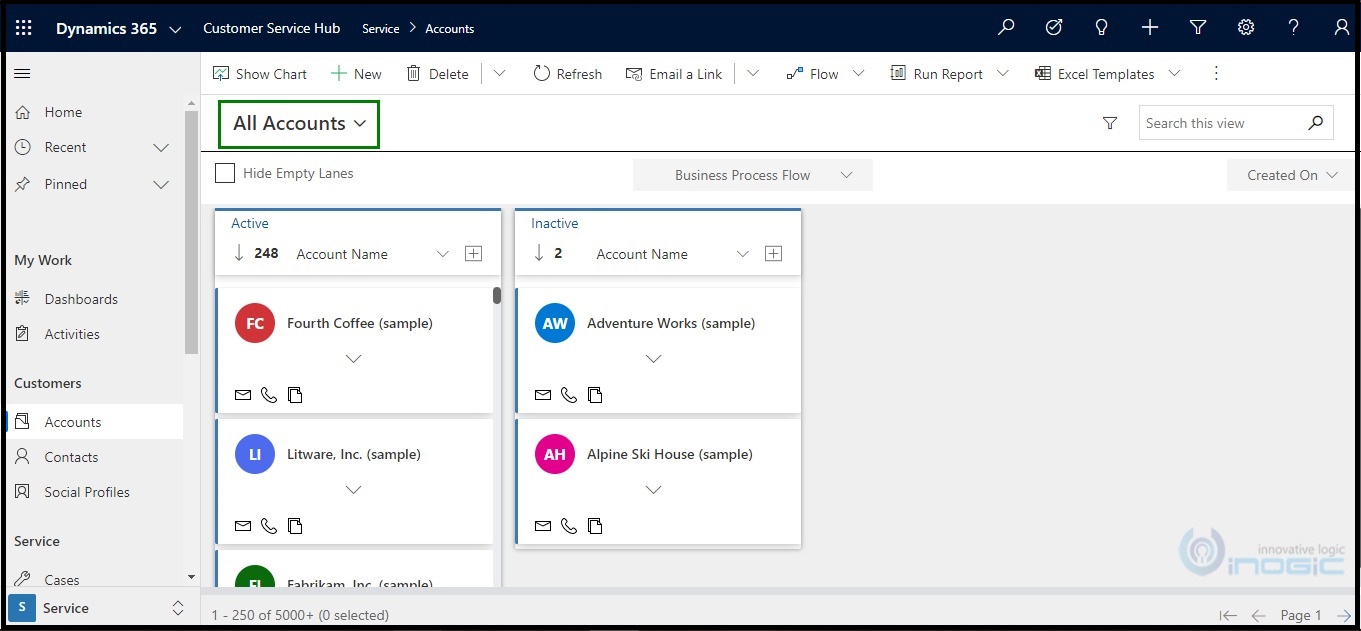
Apart from the entity, you can configure Kanban control for a specific view in Dynamics 365 CRM/Power Apps. Here, it is configured for the ‘All Accounts’ view.
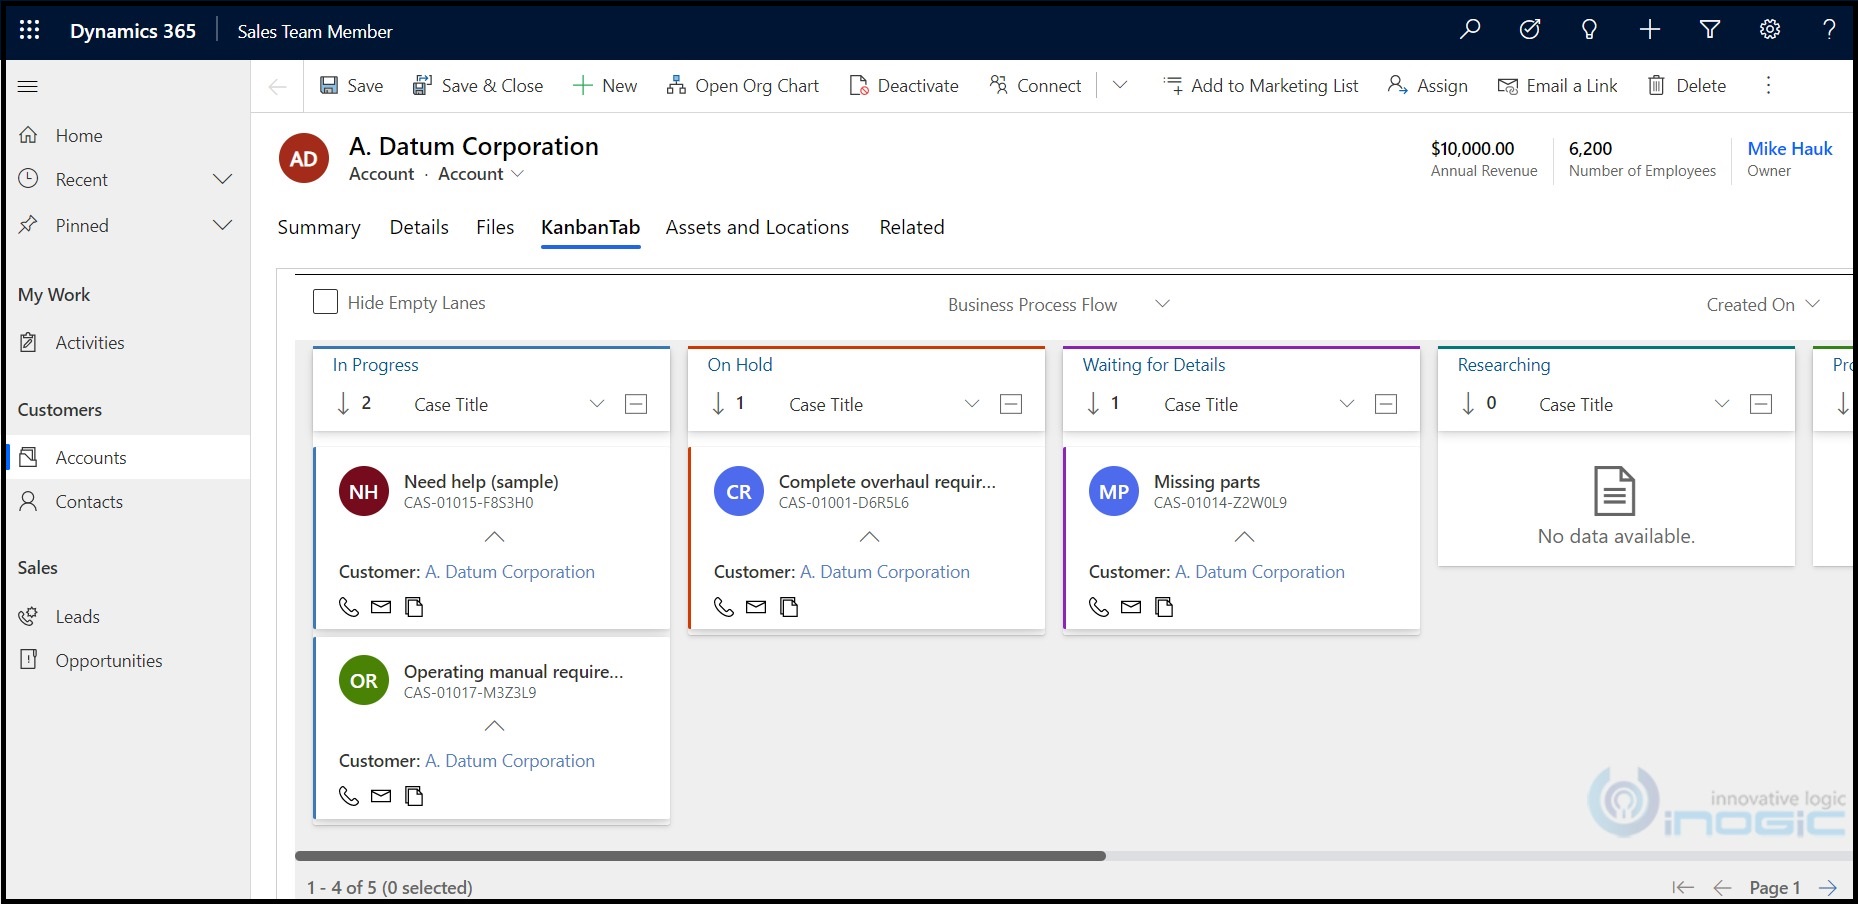
That’s not all! You can also configure Kanban control for Subgrid. Here, it is configured for cases in Account entity.
And this just the tip of the iceberg.
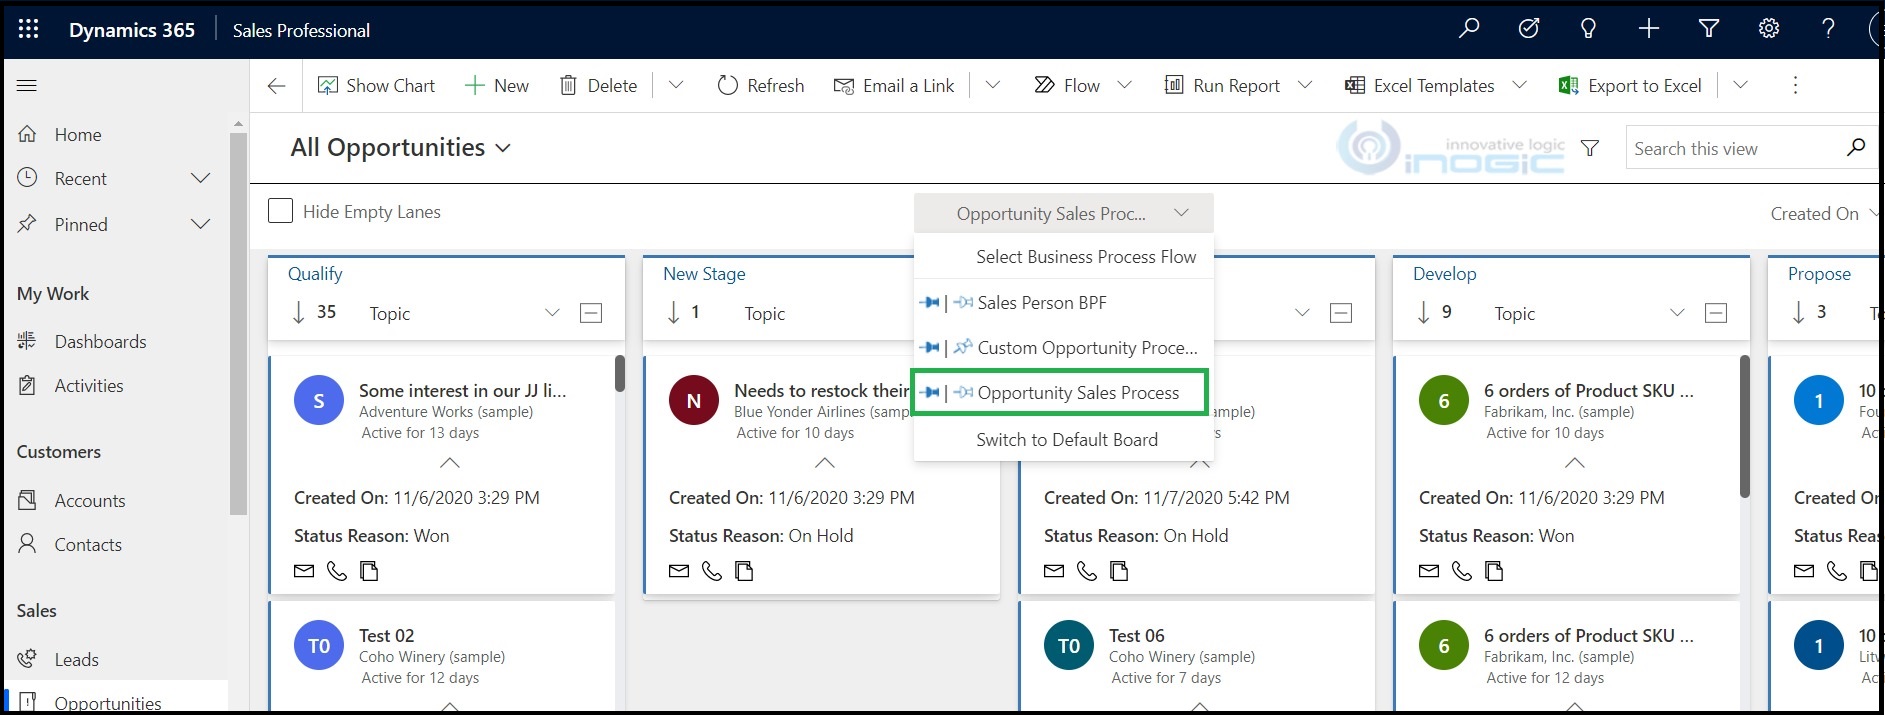
With Kanban Board, you will be able to organize and categorize the records of an entity as per the Business Process Flow stages of that entity. This will give you a clear picture of the progression of various tasks at your end. You can effectively make quick decisions and take action based on this analysis. You can also pin the Business Process Flow for personal or global use.
Once the Kanban View is configured for Entities, View or Subgrid, you can easily drag and drop the cards from one lane to another and quickly update the underlying field values.
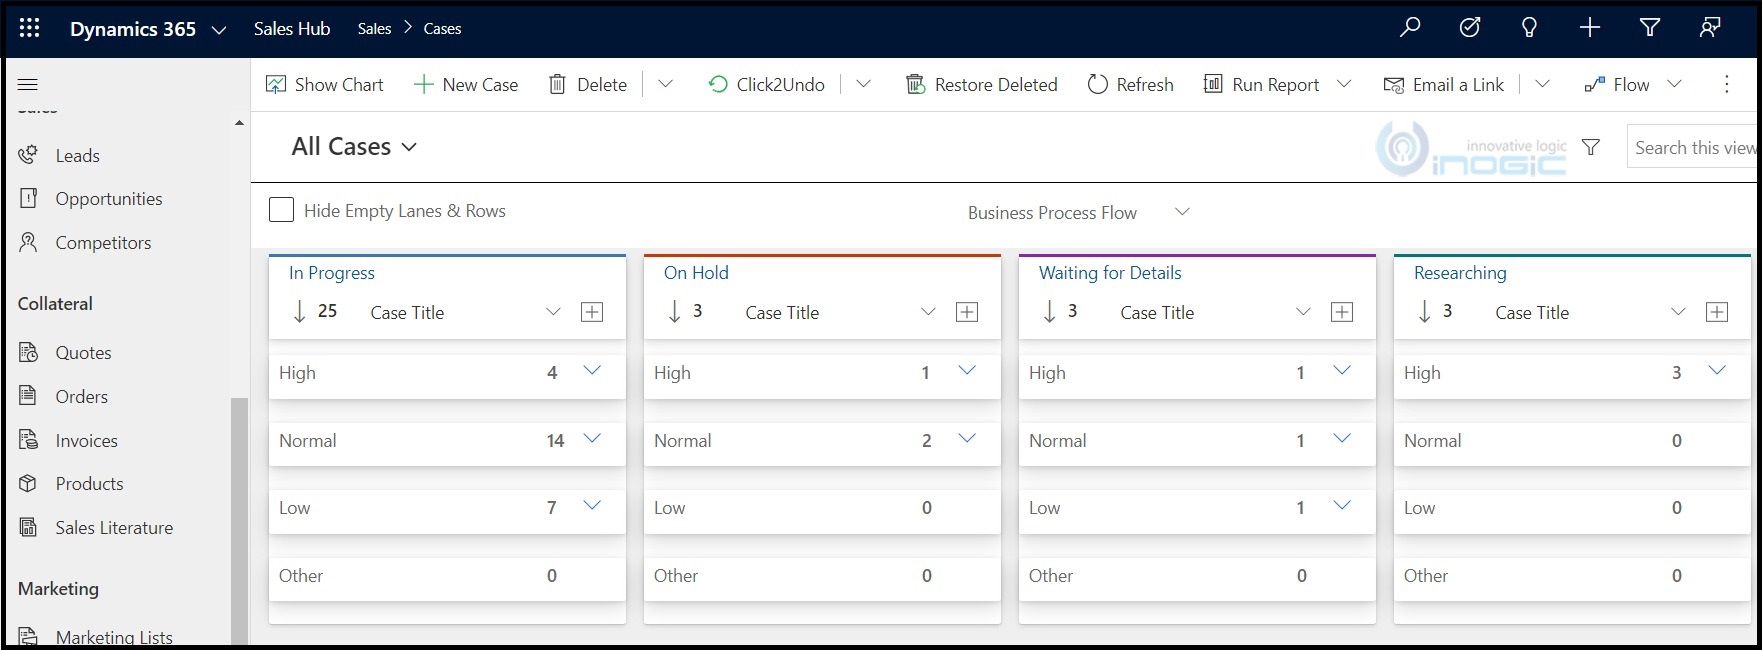
Another interesting feature is that you can also group records in a row based on any field value. Here, the records are categorized in rows based on priority – High, Normal, Low, Other.
And this is still not the end. There are still MORE features. Now, you can discover all those by downloading this amazing solution from our website or Microsoft AppSource for a trial period of 15 days.
All in all, Kanban Board is an apt app to have at your end if you want a different look for your CRM. So, don’t miss it.
Well it’s not just this, if you prefer to have a Mind Map visualization of your Dynamics 365 CRM/ Power Apps data then you definitely need to look at our Map My Relationships – another of our preferred app on Microsoft AppSource.
As always, please feel free to contact us at crm@inogic.com for any visualization queries.
