Introduction:
In the previous blog, we already explored the “Customer Service Historical Analytics” report and the different dashboards available.
Recently, I was going through this doc where different KPIs are listed. I was interested in “Avg. CSAT” and “Avg. survey sentiment” which were not displayed and shown as blank. This made me explore and find out when the data will be updated in these two KPIs.
In this blog, let us have a brief look at the below KPIs and see how they are displayed in the report.
- CSAT– The average customer satisfaction score based on the Customer Voice survey submitted by the customer.
- survey sentiment– The average sentiment score based on Customer Voice survey written feedback submitted by the customer.
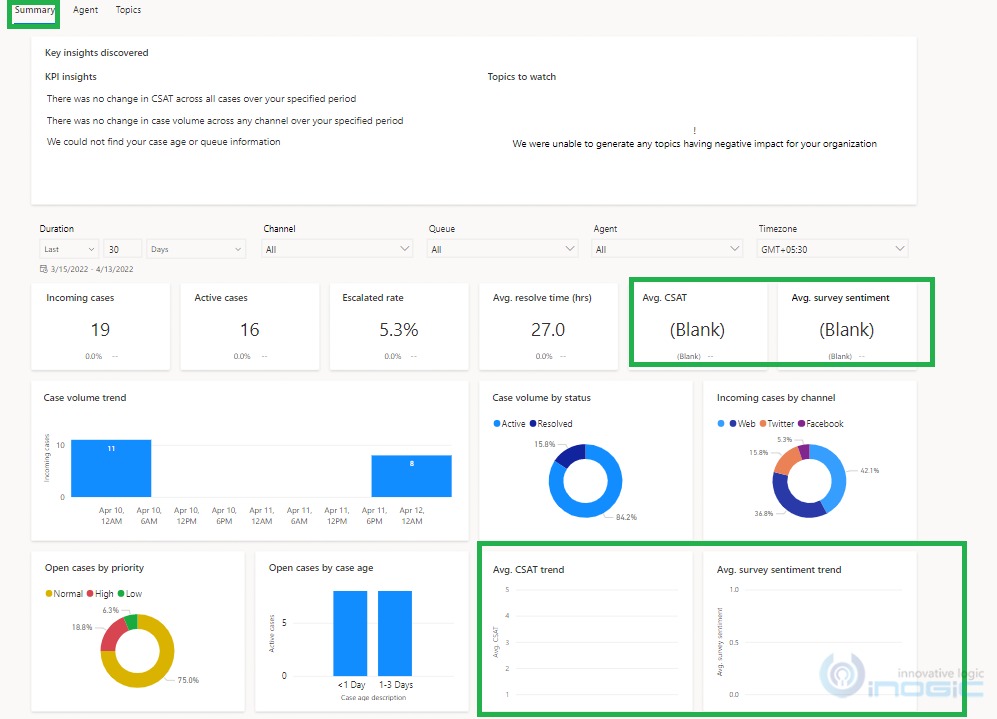
To view these two KPIs, open “Customer Service hub”–>under the “Service” area–> navigate to “Insights”–>open the “Customer Service Historical Analytics”.
As you can see in the below screenshot, under the “Summary” dashboard KPIs like “Avg. CSAT”, and “Avg. survey sentiment” are Blank as there are no relevant data available in the organization.
NOTE: For the above KPIs to be displayed on the report, you need to sign up for Dynamics 365 Customer Voice.
For this demonstration, let us assume that you already have “Customer Voice” integrated into the organization. If you have not integrated it yet then refer to this doc for information on how to integrate it.
Now, under “Customer Voice”, create a new project and under it create one survey. You can refer to this doc for details.
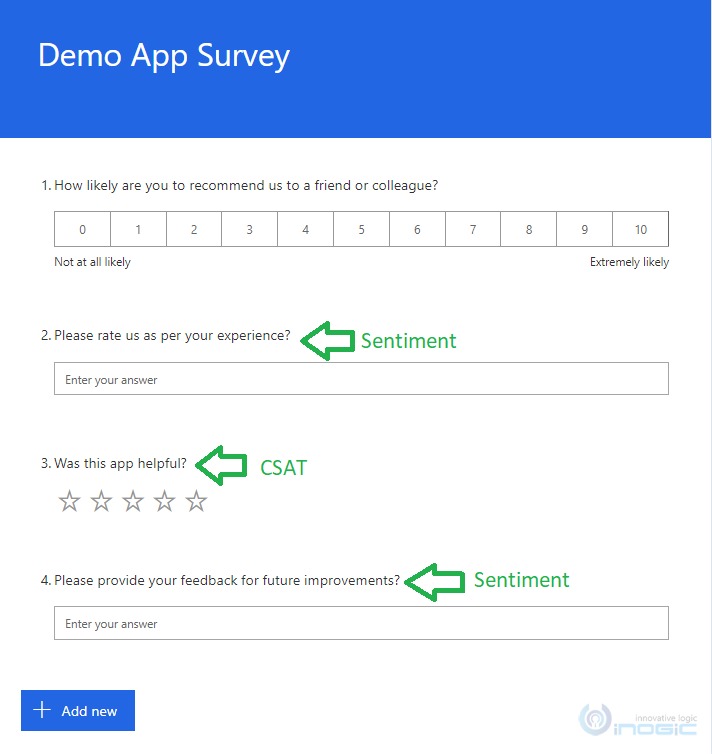
I have created “Demo App Survey” in “Customer Voice” and added relevant survey questions for tracking the Sentiment and CSAT score as shown below:
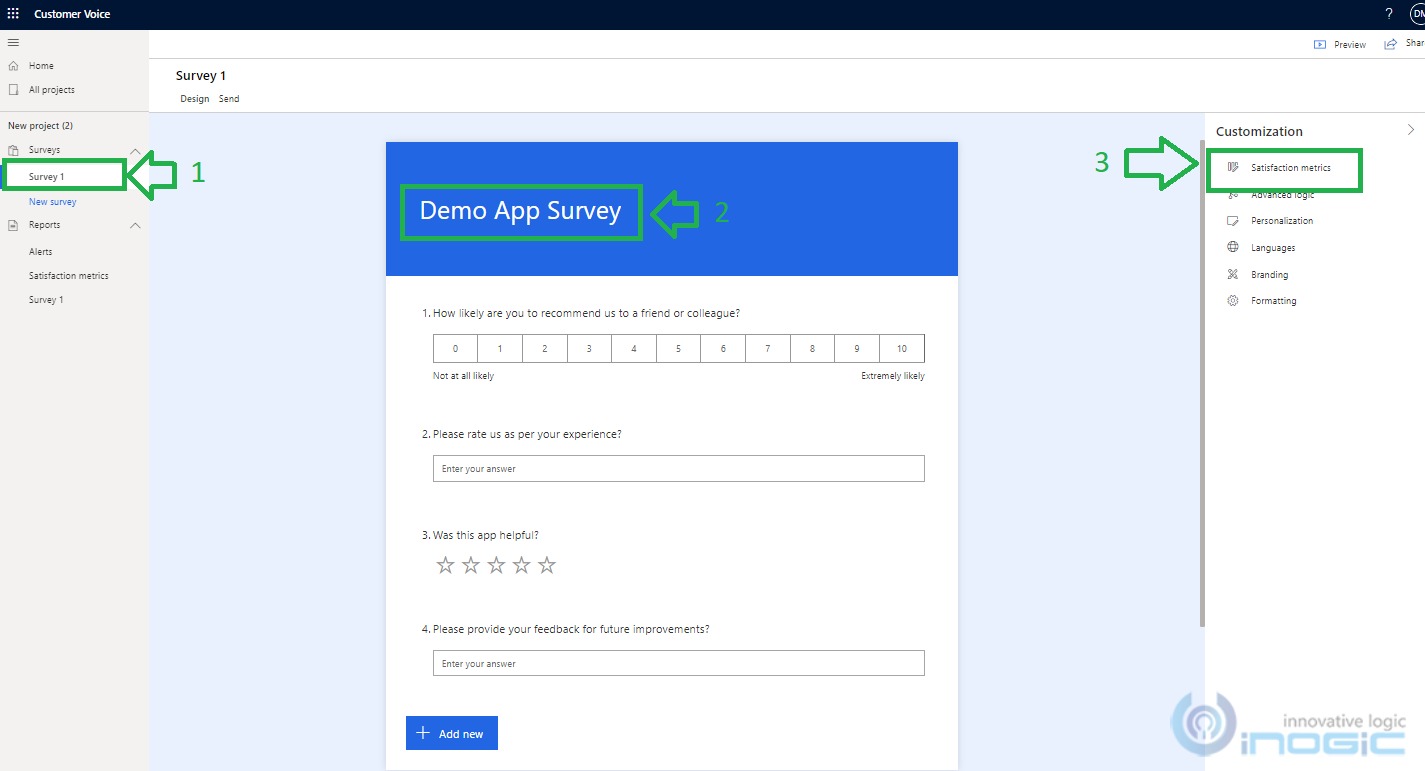
As shown in the below screenshot, after logging in to “Customer Voice” I first created a project named “Survey1”. Under this project, I created a survey named “Demo App Survey”. Next, open the “Customization” menu (at the rightmost) under which you need to click on “Satisfaction metrics” as shown below:
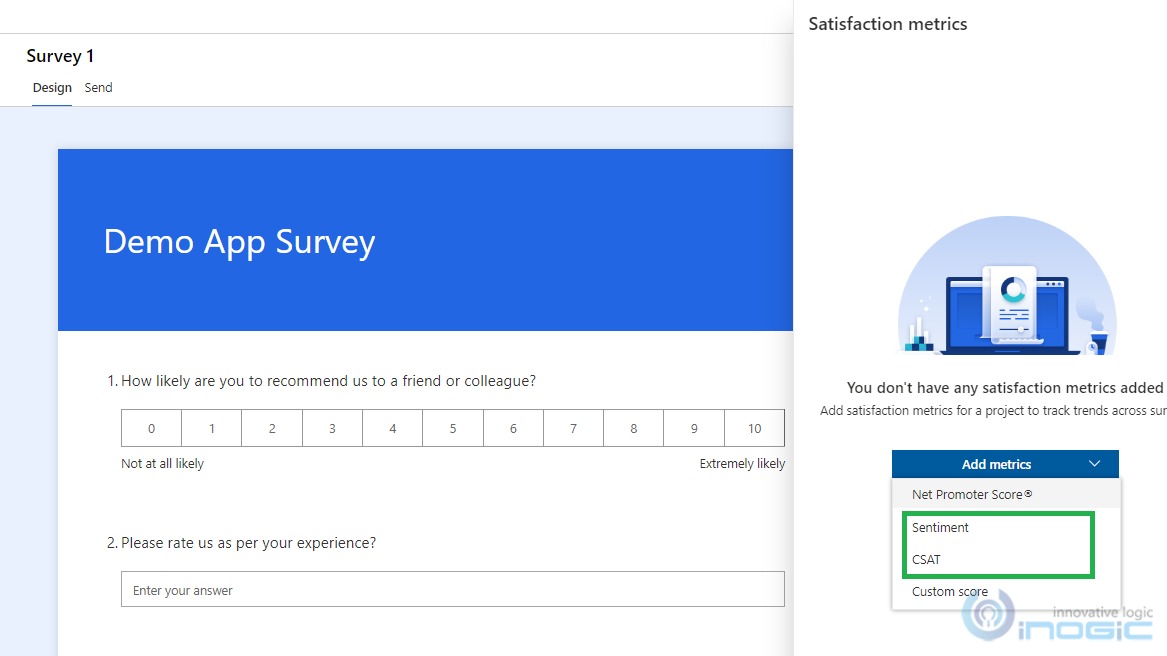
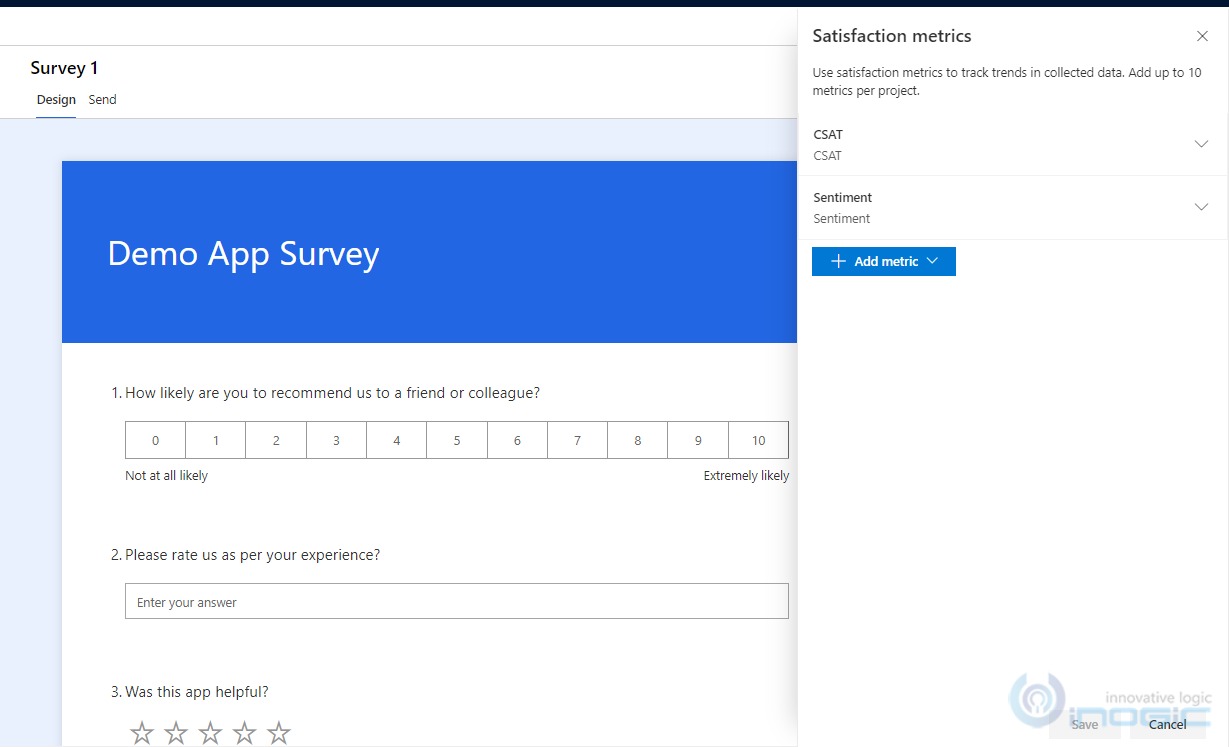
There you can create metrics of type “Sentiment” and “CSAT” by selecting corresponding metrics and attaching the relevant questions to each metric as shown below:
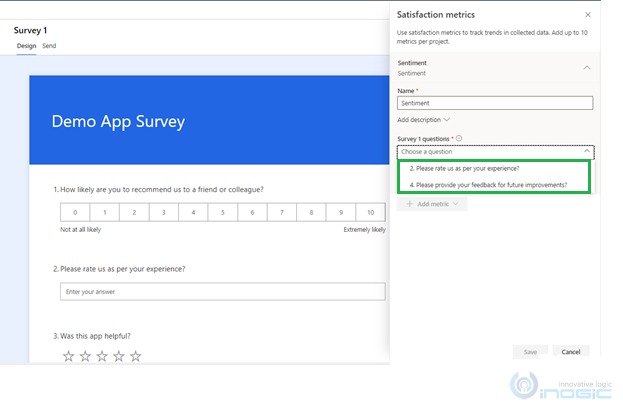
Sentiment Metrics creation: While creating “Sentimental Metrics” as shown below I have selected below two questions. Now if the user responds to these questions, then that will be captured as their sentiments and displayed in the report as “Avg. survey sentiment” KPI factor in the report.
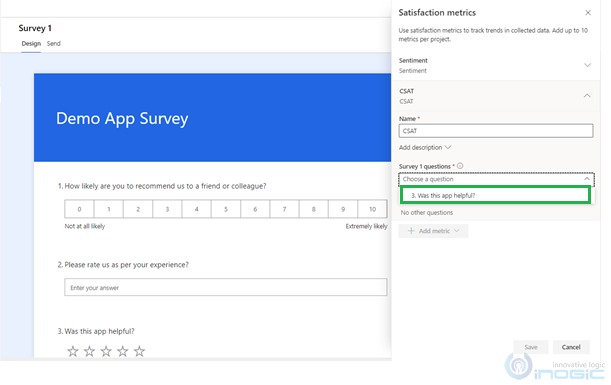
CSAT Metrics creation: While creating “CSAT Metrics” as shown below I have selected one question. Now if the user responds to this question, then that will be captured as their CSAT and displayed in the report as “Avg. CSAT” KPI factor in the report.
Now I have both the metrics present as below:
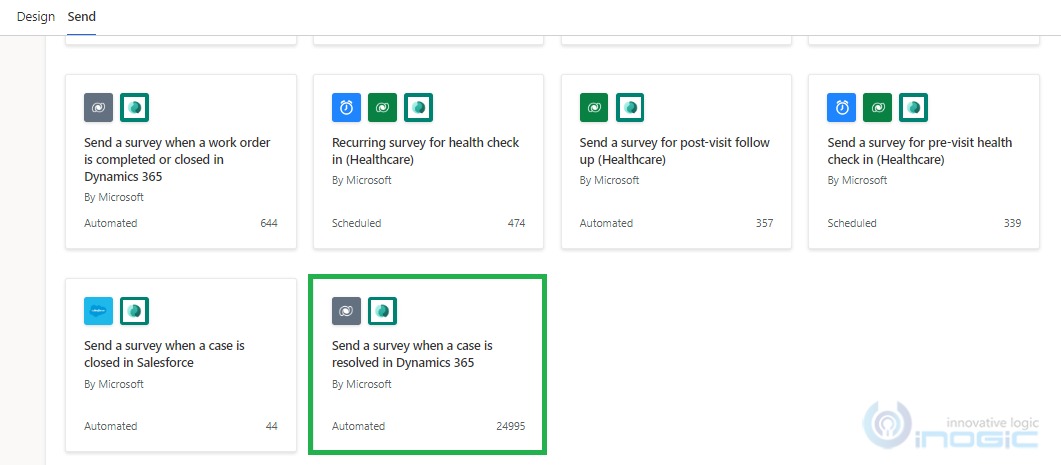
The next step is to send the survey. For this, go to the “Send” tab of the created survey as shown below and click on “Automation”.
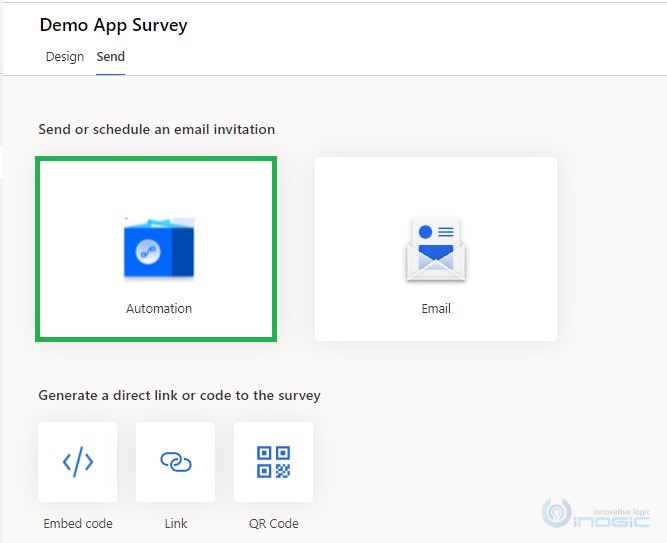
There are many templates available out of which for demonstration purpose, I selected the “Send a survey when a case is resolved in Dynamics 365” template as shown below:
Use Case:
- When the case is resolved in Dynamics 365, the customers should receive one feedback form through the survey from where they can send the response.
Solution:
- The POWER AUTOMATE (FLOW) configured with the above survey will trigger when the case is resolved. It will send the customer feedback form over email to the Account or Contact (“Customer” field on Case) present on the case record.
- When case resolved in Dynamics 365;
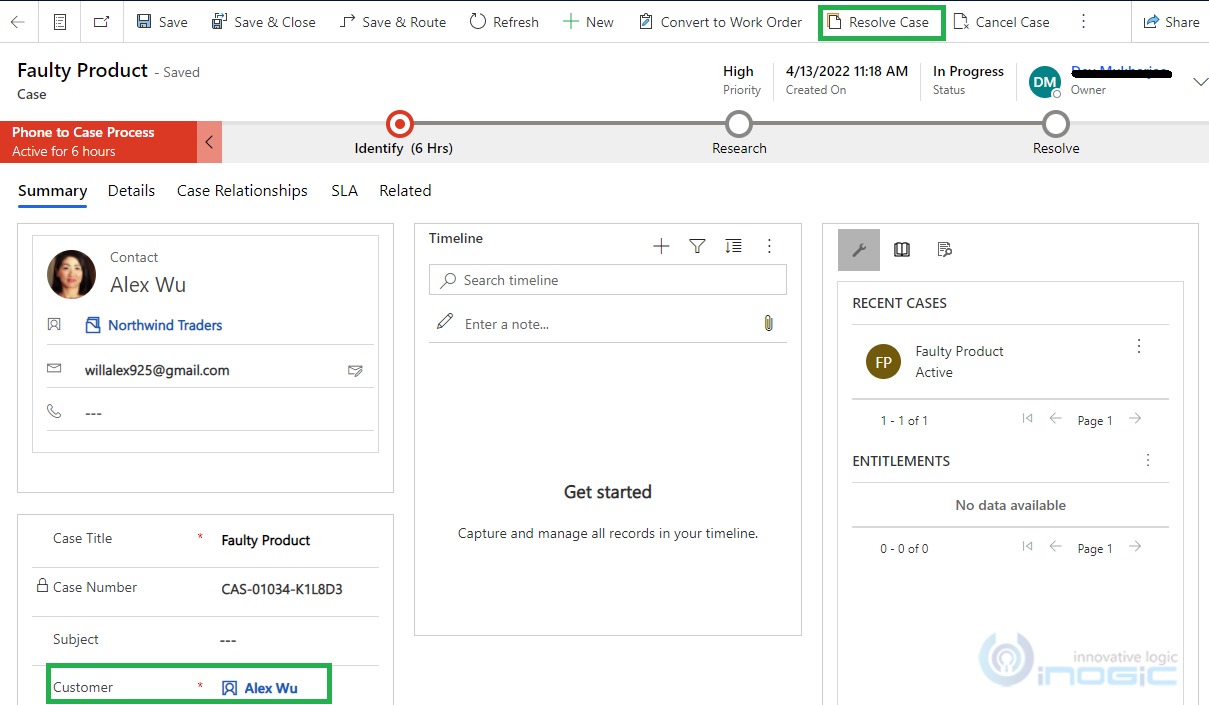
- “Alex Wu” customer set on Case receives the email for starting the survey.
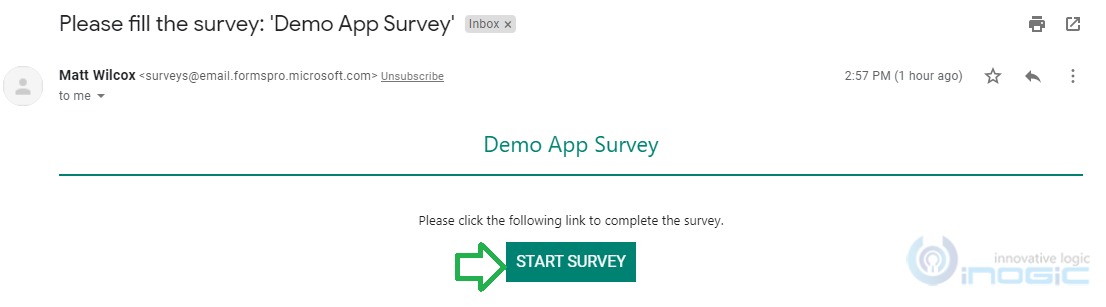
- When “Alex Wu” clicks on the “START SURVEY” button, the survey page opens up.
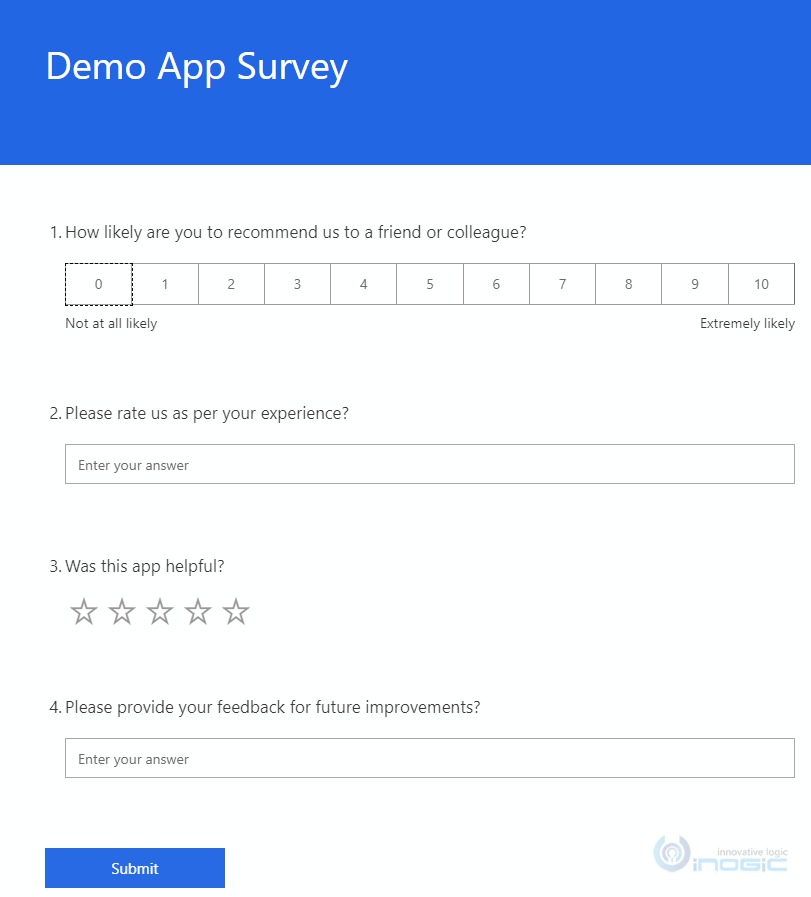
- When it is filled and submitted accordingly “Avg. CSAT”, and “Avg. survey sentiment” start displaying on the report.
NOTE: It won’t be displayed instantly as the report waits for system refresh which you can see through the “Last Updated” date displayed on the report.
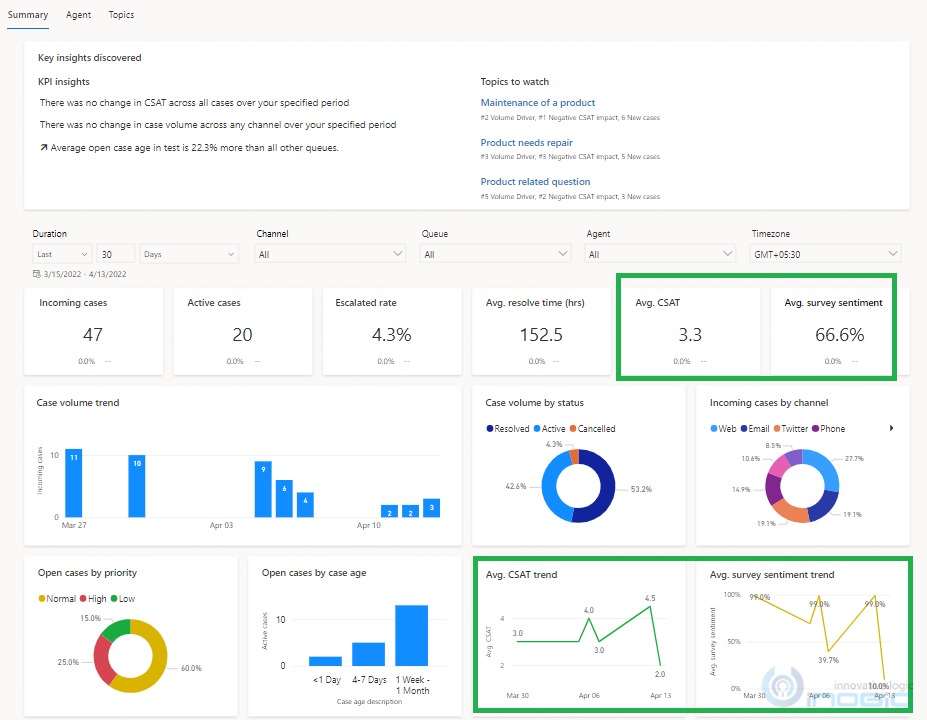
Once refreshed, the “Avg. CSAT”, and “Avg. survey sentiment” KPIs and “Avg. CSAT trend”, “Avg. survey sentiment trend” metrics are displayed as shown below:
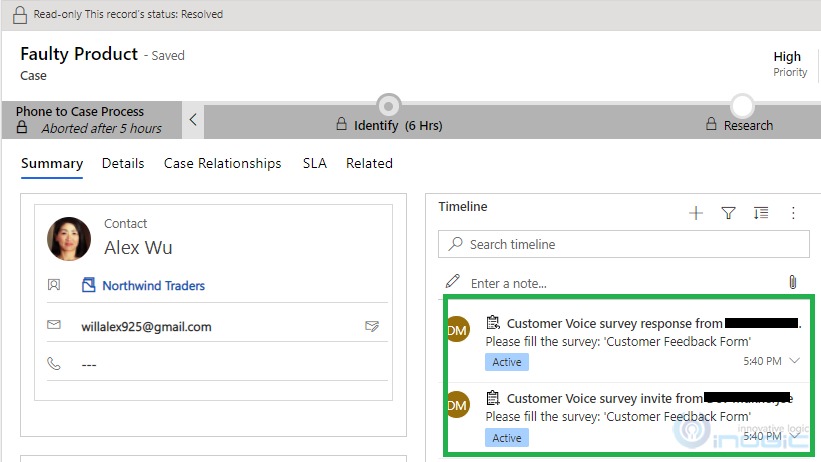
- On the timeline of resolved case you can find the “Customer Voice survey invite “ and its corresponding “Customer voice survey response” as shown below:
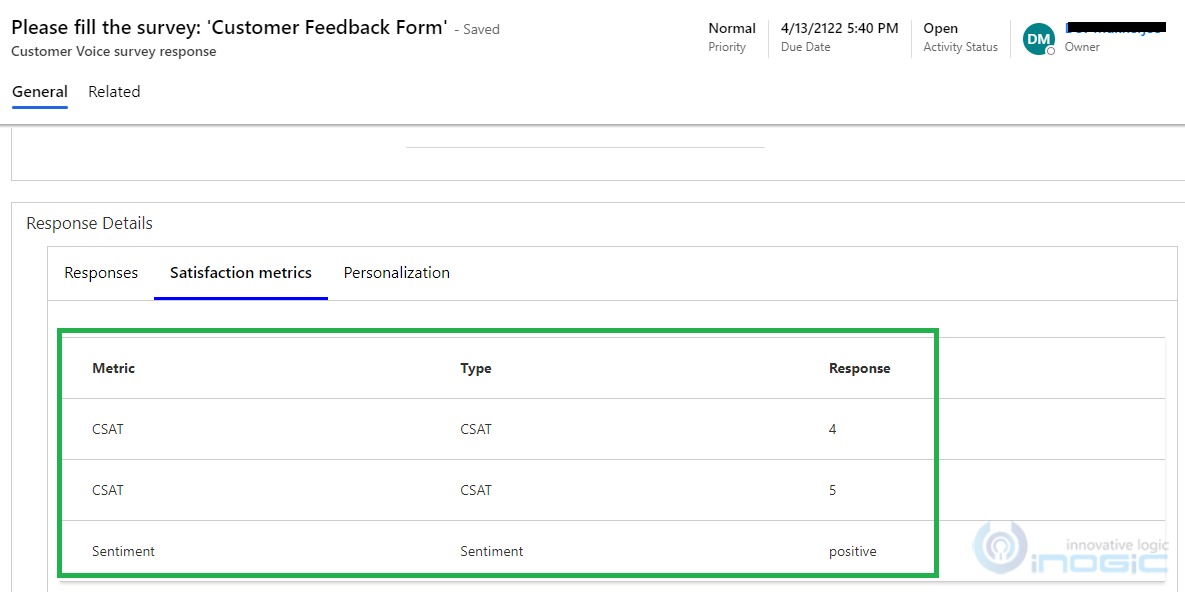
- If you open the “Customer voice survey response” record, you can see the “Satisfaction metrics” response where it gets stored:
For more details on how customer surveys invite and response works, please refer this doc.
Conclusion:
In this blog, we explored how the data is displayed in “Avg. CSAT” and “Avg. survey sentiment” KPIs. The KPI summary charts are useful to summarize the key performance indicators for the specified period and the percent change over the period. It helps to evaluate performance and business impact and also to identify inefficiencies in providing the service.