Introduction:
For a long time now, perhaps from version 2011 of Microsoft Dynamics CRM, we could design charts and these charts are displayed as a contextual pane beside the views that display the requested charts using the data currently being displayed in the View.
It is only recently that we discovered a hidden gem, the ability to use the Chart Area and Charts to display custom web resources. And that also means we can display HTML web resources as Charts 🙂
How to display web resources in Charts?
Charts have traditionally been visualized to be graphic visualization to support Bar graphs, columns graphs, and the likes. The Chart is represented in an XML format and it is possible to export the chart XML, edit is outside of CRM and import it back. This has been used as an accepted way, especially to represent data in a specific format that is not possible through the Chart designer UI made available in CRM.
Chart XML structure to support custom visualizations:
<visualization>
  <name>visualization name</name>
  <description>description</description>
  <webresourcename>name of webresource</webresourcename>
  <primaryentitytypecode>entity logical name</primaryentitytypecode>
  <isdefault>true or false</isdefault>
</visualization>
Steps to add your own visualization:
1. One of the ways to create web resource visualization is to create an XML file in the following format.
<visualization>
  <name>Show accounts on map</name>
  <description>Used to show the account on map</description>
  <webresourcename>ikl_/showMap.html</webresourcename>
  <primaryentitytypecode>account</primaryentitytypecode>
  <isdefault>false</isdefault>
</visualization>
The usual chart XML parameters
<datadescription></datadescription>
<presentationdescription></presentationdescription>
that were used in traditional charts to represent the chart layout and data series can be used to pass any custom parameters that may be required by the web resource being displayed in the chart.
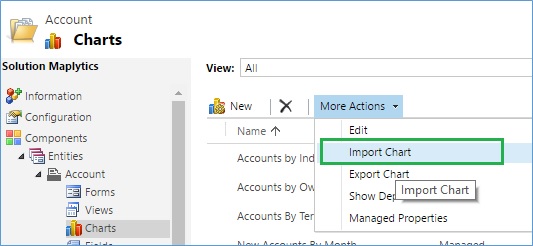
2. Use Import Chart button as shown in the below screenshot to import the visualization;
3. If you want to programmatically create it, savedqueryvisualization is the entity that stores the details of the chart.
//create entity object
               Entity webResVisualization = new Entity("savedqueryvisualization");

                //set the properties

                webResVisualization["name"] = "Show Accounts on map";

                webResVisualization["description"] = "Show Accounts on map.When user select the view";

                webResVisualization["primaryentitytypecode"] = "account";

                webResVisualization["webresourceid"] = new EntityReference("webresource", new Guid("5568E744-B2B0-E211-B3D8-D0B0350F4F16"));

                //create web resource visualization record
                _service.Create(webResVisualization);
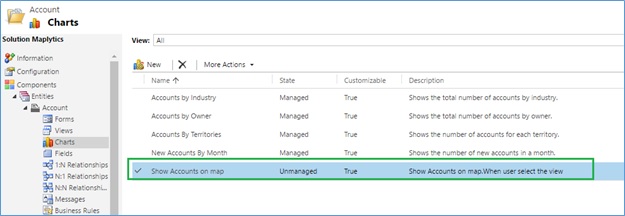
When it executes successfully, it creates the Charts Record as shown in the below screenshot;
4. When you open the Account entity home page grid and select any view and then select the chart that we have created, it will display the HTML web resource with all accounts plotted on Map;

Note: The webresource will receive the selected chart id and view id as a query string parameter that can be parsed to execute the view and read the records that need to be processed by the HTML web resource for visualization.
Conclusion:
Use the web resource visualization to display custom content in the context of the view.
Resources:
The following links from the SDK helped us to get this working!
https://msdn.microsoft.com/en-us/library/gg328492.aspx