Dashboards are the one of the most used feature of Maplytics-Bing Map Integration for Dynamics CRM. You can design geographical dashboards using components from Maplytics as can be seen in the screenshot below.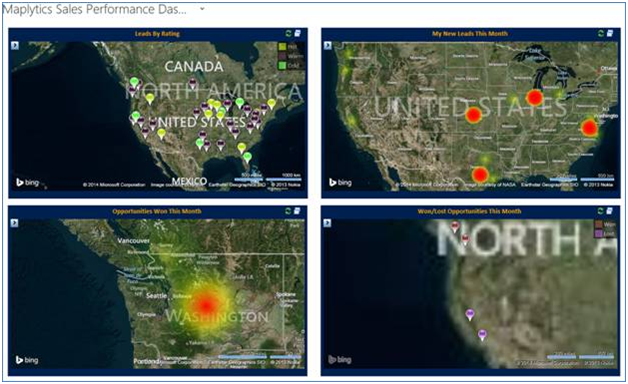
Maplytics ships with the following 5 pre-defined Dashboards for various Sales and Service Modules for different user roles.
- Maplytics Customer Service Representative Dashboard
- Maplytics Overview Dashboard
- Maplytics Sales Activity Dashboard
- Maplytics Sales Performance Dashboard
- Maplytics Service Manager Dashboard
Dashboards are based on the Dashboard views that are configured in Maplytics. In this article, we will walk you through the steps to add a Dashboard view and then include the same in a Dashboard.
Steps to Configure Dashboard Views:
Go to Settings -> Dashboard Details -> New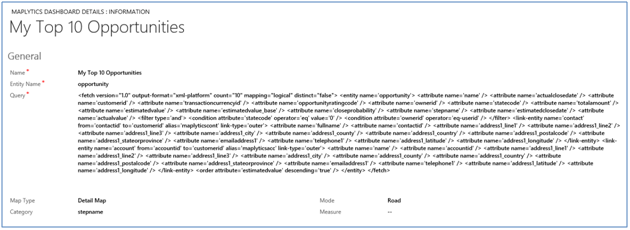
Name:
The unique name for the Dashboard. You will use this name to define the view to be included in the Dashboard.
Entity Name:
Logical Name of entity for which the view is to be configured for.
Query:
FetchXML query for selecting the data to be plotted on the Map. You can create queries using Advanced Find and download the FetchXML generated and set that here.
When you want to design queries that would read the address information from the related entity make sure to use the alias as “map” in the link clause of the fetch query.
For lookups that are of the type customer, i.e it can either hold an account or contact when linking with the account and contact entity make sure to use the alias “maplyticsacc” and “maplyticscont” respectively. An example of the customer type of lookup would be the “customerid” attribute on the opportunity or case.
Note: Make sure to include address1_latitude and address1_longitude attributes in the query for the map for the record to be plotted on the map.
Category:
The schema name of the attribute to be used for categorization of the result set. The pushpins are color coded based on the attribute defined here. Each unique value of the category would be assigned a different color.
Category is only used if the Map type selected is Detail. For Heat Map representation the value of this field is ignored.
Map Type:
Decide if you would like a Detail Map representation or a Heat Map representation of the result set. Detail Map will plot individual pushpins for the records while Heat map will present a heat map based on the query result.
Mode:
Choose the default mode in which the map should be presented. Choices available are Aerial or Road.
Measure:
This field is used for heat map if you want to show the heat map based on value. The default hear map representation decides the intensity of the heat in a region based on the count of records retrieved for that region. If you wanted the intensity to be calculated instead on the value of the record rather than the count, provide the schema name of the field that should be considered to determine the intensity.
Tooltip Attribute:
Provide the list of attributes that need to be displayed as a tooltip on the pushpins. You can use Fields Mapping UI to configure tooltip attributes.
Note: Make sure that all the attributes you have added for tooltip must be included in the fetchxml. You can view the article here to learn how to configure tooltips.
Note: Tooltips are not displayed for Heat Maps.
Steps to add Maplytics View to Dashboard:
To include the Maplytics component in Dashboard, click on Web Resource from within a Dashboard design form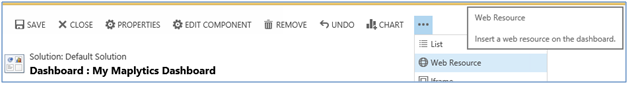
Set the web resource properties as shown below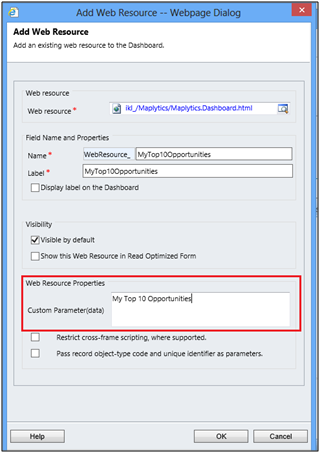
Choose “ikl_/Maplytics/Maplytics.Dashboard.html” as the web resource to be used.
You can provide an appropriate name and label to the web resource component.
Provide the name of the Dashboard view to be presented in the web resource in the “Custom Parameter(data)” property of the web resource. If this information is missing or incorrect the map will not show up on the Dashboard.
Save and publish the Dashboard and you are ready to see the map on your dashboard.
No need to switch your screen to search anything on Bing Maps…Maplytics works from within your Dynamics CRM. Check out now.