Introduction
In today’s blog, we will explore how to implement FirstN(), LastN(), and Index() functions for filtering records of the Data Table in the Canvas App.
We had a client requirement where we needed to find out the top three highest Annual Revenue customers and bottom three lowest Annual Revenue customers for boosting their business.
To achieve the above requirement, we used Canvas App. Please find the below steps that we used to get the desired results:
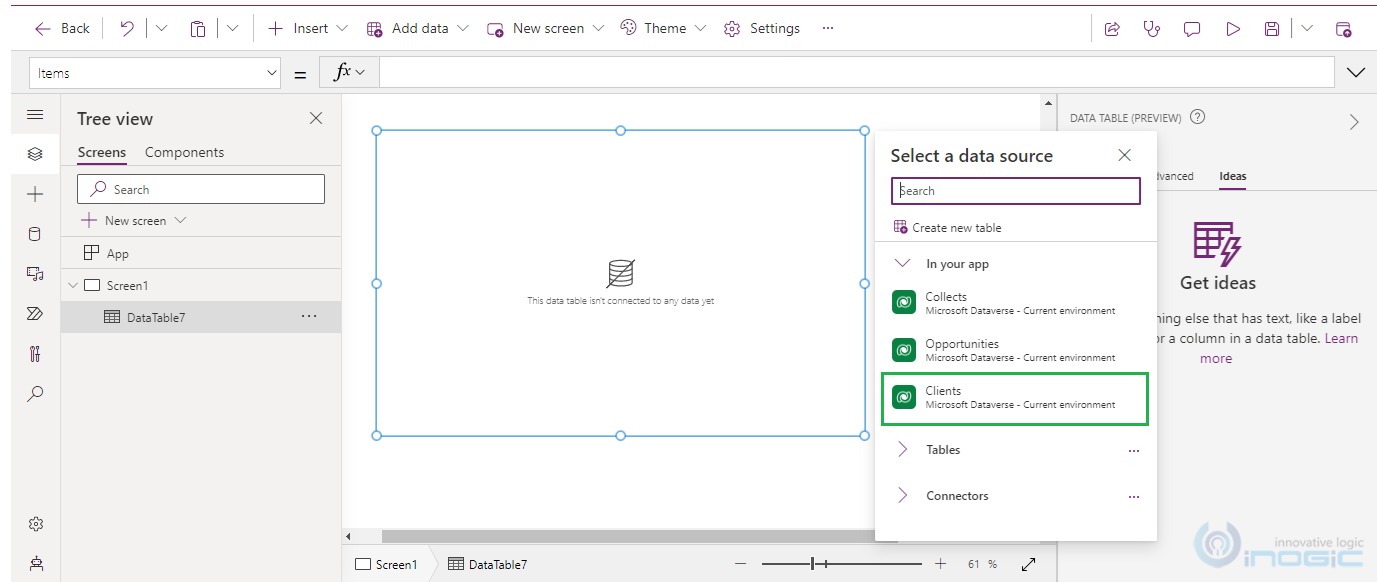
Step 1:
We created a default Canvas App and in that, we added a DataTable. After creating the data table, we added the Client custom table in it which contains customer details such as Name, and Annual Revenue. As seen in the below screenshot. Also, we sorted the data in descending order based on annual revenue using the Sort function. Please find the below Power Fx formula that we used to sort the Data Table:
Sort(Clients, Revenue, Descending)
Step 2:
After sorting the data table by annual revenue, we performed the below operation:
1. FirstN()
The FirstN() function returns the first N set of records of a data table.
Syntax:
FirstN(TABLE_NAME,NUMBER_OF_RECORDS)
Where,
TABLE_NAME: Table name is specified on which we perform the operation
NUMBER_OF_RECORDS: Numeric number which specified how many rows we want to retrieve from the data table.
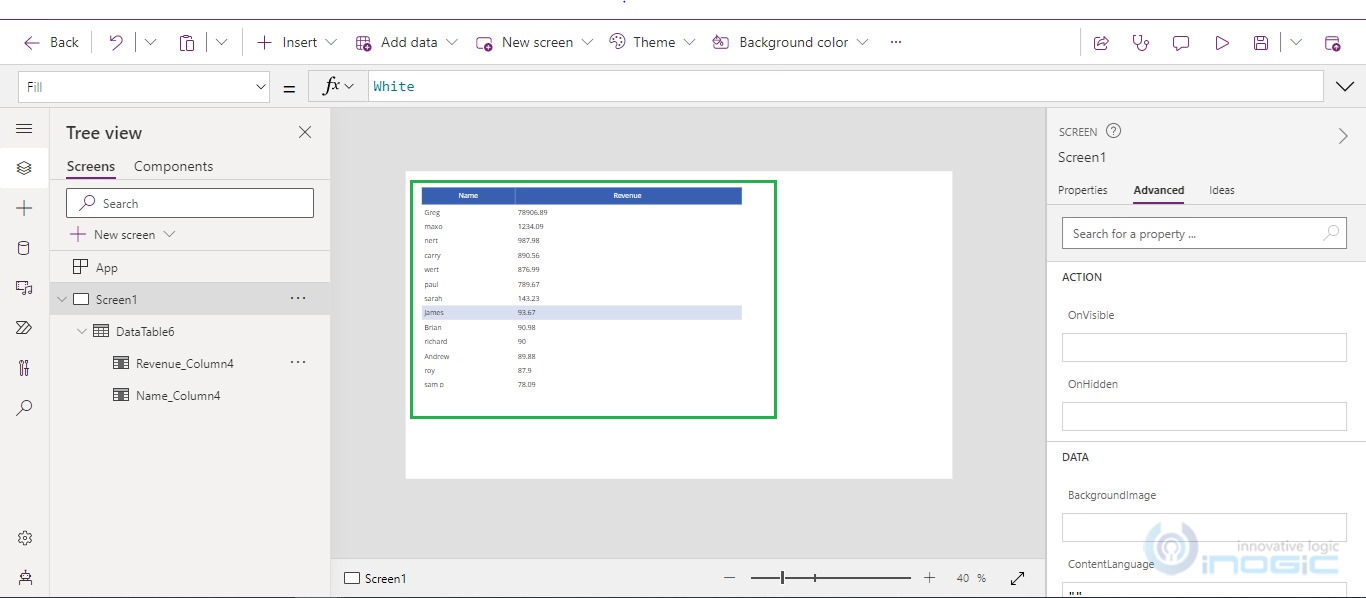
In our case, we want to retrieve the Top three customers which have the highest annual revenue. So, we create the Power Fx formula as below:
FirstN(Clients,3)
After applying the Power Fx formula, we will get the below result in the data table. You can see the top three customers which have highest annual revenue displayed in the screenshot:
2. LastN()
The LastN() function returns the last N set of records of a table
Syntax-
LastN(TABLE_NAME,NUMBER_OF_RECORDS)
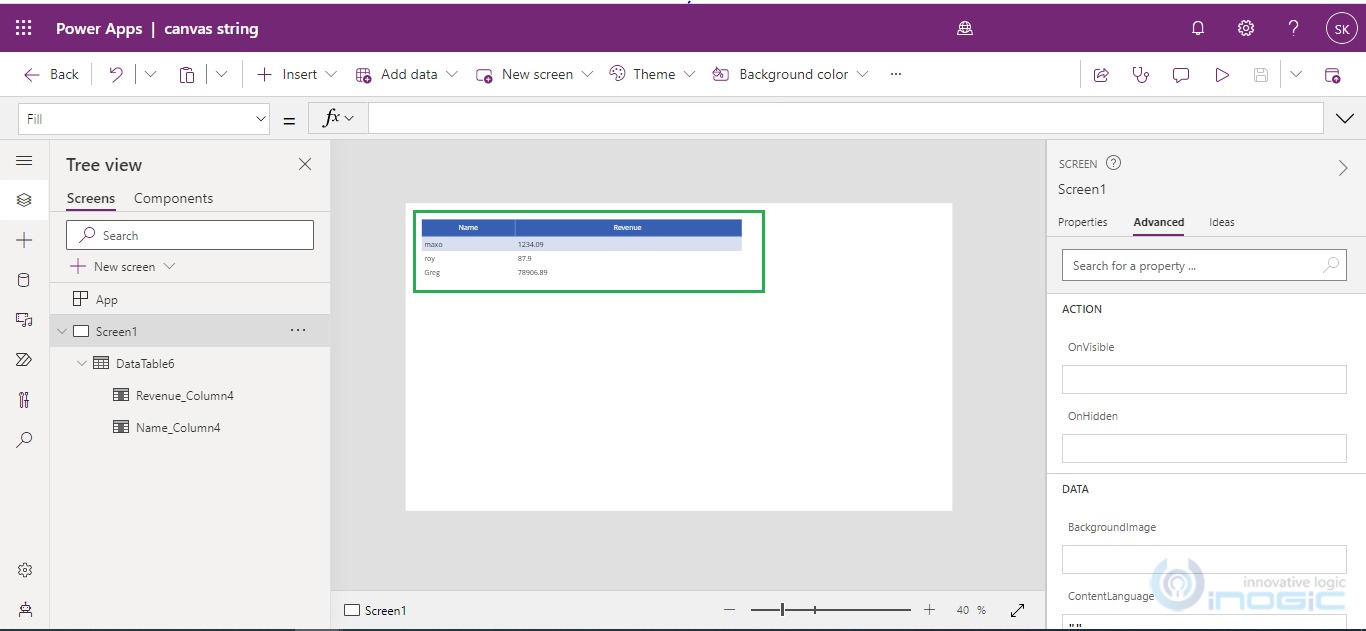
In our case, we want to retrieve the Last three customers which have the lowest Annual revenue. So, we create the Power Fx formula as below:
LastN(Clients,3)
After applying the Power Fx formula, we will get the below result in the data table. You can see the lowest three customers having the lowest annual revenue displayed in the screenshot:
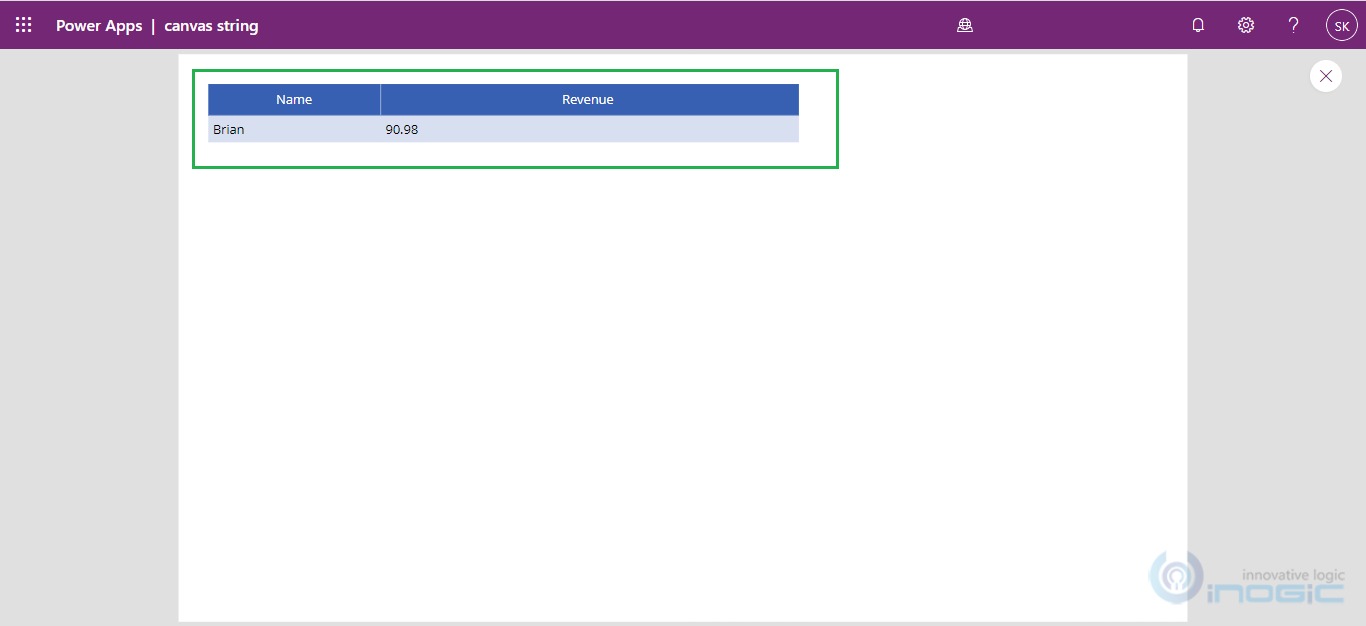
3. Index()
The Index function returns a single record of a data table based on its ordered position in the table.
Syntax:
Index(TABLE_NAME,NUMBER_OF_RECORDS)
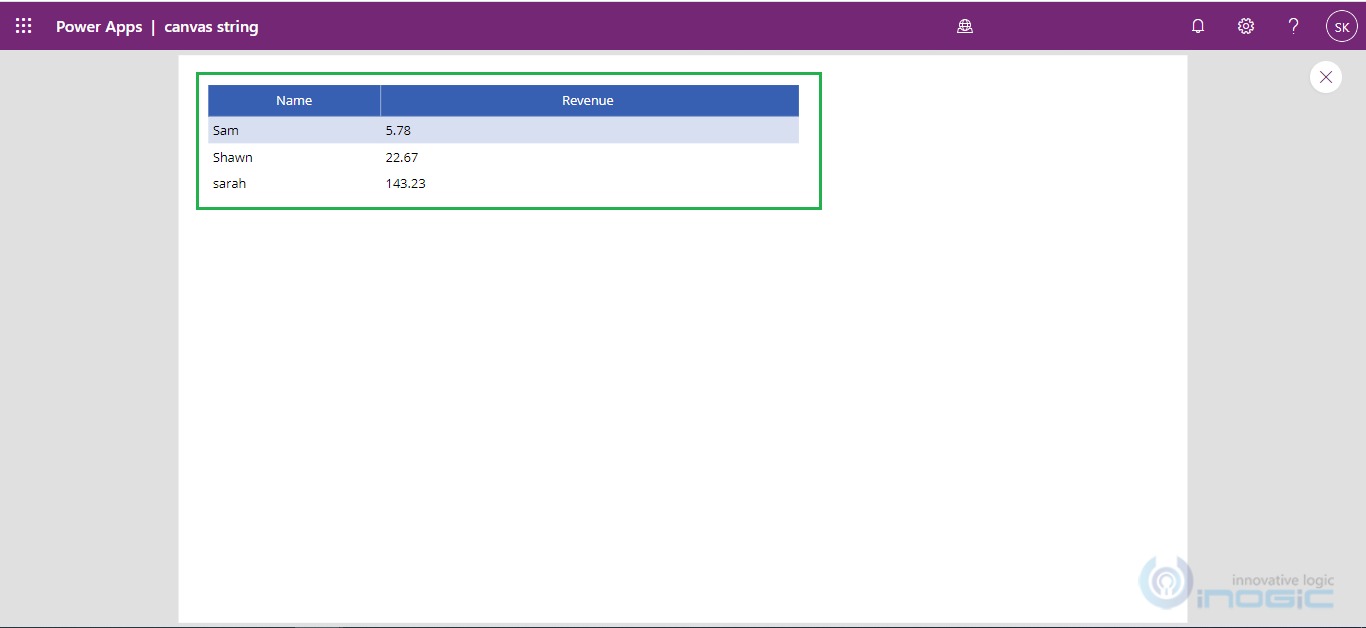
Example:
Index(Clients,3)
Output-
Conclusion
In this way, using FirstN(), LastN() ,and Index() function we can easily filter the data table in Canvas App.