Recently, data visualization apps have become an integral part of many business processes. Increasingly, companies across the world are taking advantage of these tools to sort through massive amounts of data and for presenting it to stakeholders and business owners in ways that they can understand. Quicker decisions, improved insight into business health, higher productivity are some of the inherent benefits of using these data visualization apps.
Kanban Board & Map My Relationships are two such visualization apps that are quite popular among our Dynamics 365 CRM friends for effective visualization of CRM data.
The importance and advantages of visualizing Dynamics 365 CRM data in Kanban View or Mind Map View were demonstrated wonderfully in a recently conducted webinar which will be a visual treat to the learning eyes. Click here to download the webinar recording.
And for those who are yet to be acquainted with these Microsoft Preferred Apps, let’s have a brief overview of them.
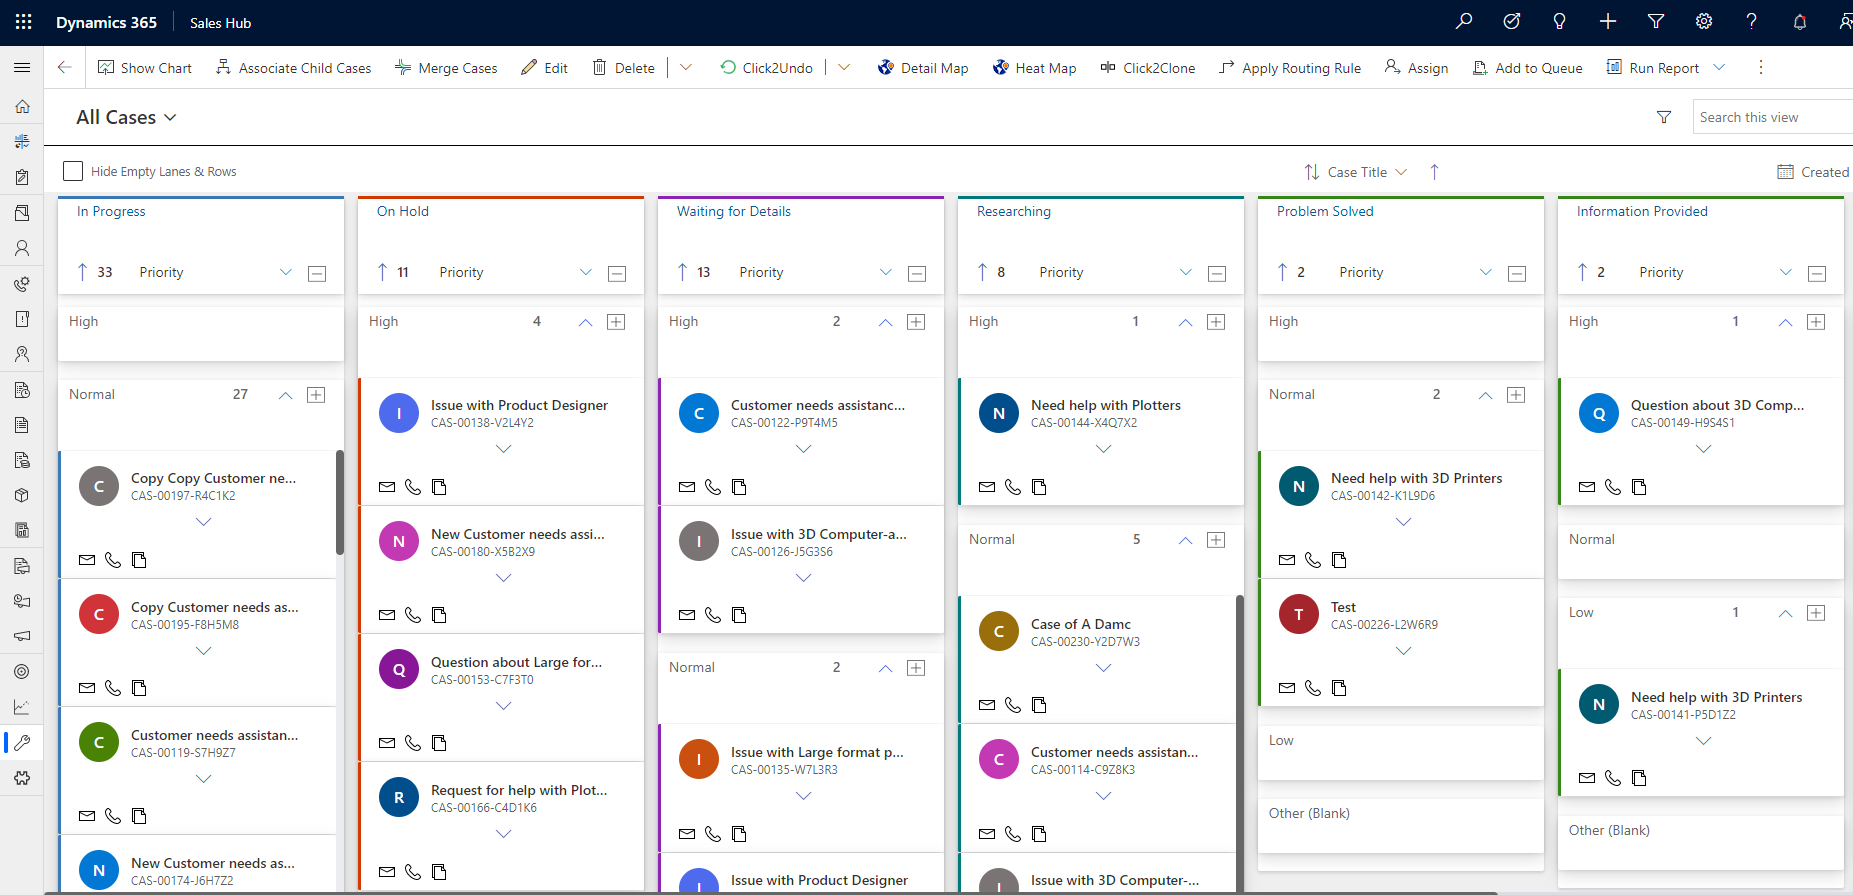
Kanban Board is a productivity app that gives CRM users an organized card-based view of Entity records in the home grid. CRM records can be organized and rearranged in multiple lanes and rows, thereby enabling easy identification of the current status of the records. Keeping track of user workloads, handling multiple ongoing projects, sorting and filtering data is a cakewalk with this visual tool.
Some of the key highlights of this product are;
- Easy Configuration across Devices: Kanban Board can be configured for Web, Mobiles, and Tablets for a unified experience. It is quite easy to switch devices from desktops or laptops to tablets or mobiles. This eliminates the mobility issues that cause hindrance to work while switching from one device to another.
- Visualize Views: Breaking away from the same old grid view, now you can visualize any Dynamics 365 CRM View as lanes and rows just like in a physical Kanban Board. The lanes and rows in the Kanban Board can be easily categorized as per the field values. You can also organize and categorize records of a given entity in Kanban view as per the Business Process Flow defined for that entity. This proves beneficial for tracking the progress of ongoing business projects.
- Easy Data Analysis: Analyzing data has become much easier with Kanban Board. Sorting records at a global level, filtering data, searching specific records, viewing aggregate values of records in lane or row headers are some of the interesting features of Kanban Board that enable to quickly and swiftly analyze data.
- User Friendly: Kanban Board comes with simple and effective features such as the drag & drop ability to move cards (records) from one lane to another, create quick activity records, etc. It works in the context of the native Dynamics 365 CRM environment & responds to all native ribbon actions as well as the quick search available for traditional views.
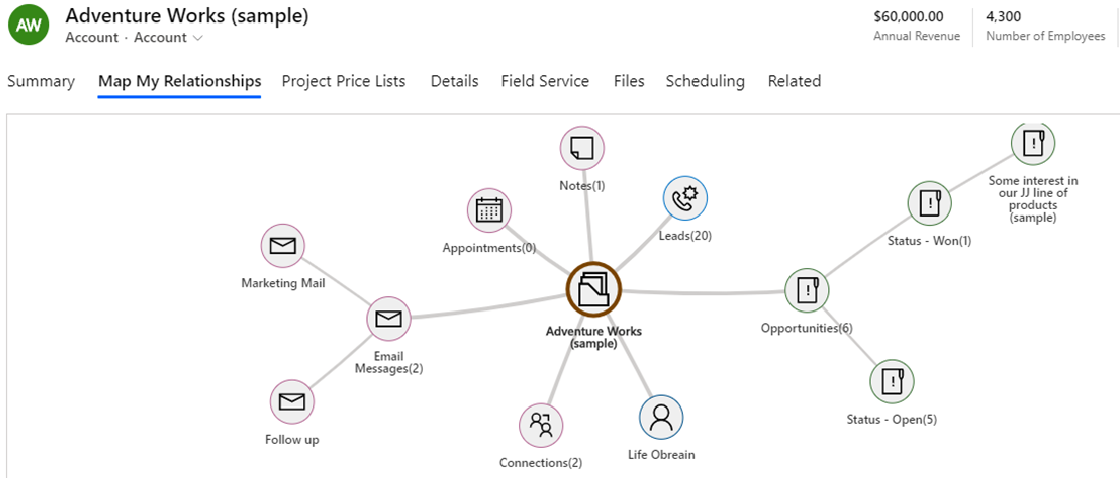
Map My Relationships is a productivity app that helps to visualize connections and relationships between CRM records in a mind map view. All the necessary information related to the respective record is made available in a single view thereby negating the need to navigate around CRM searching for various pieces of information. This proves beneficial for decision-makers to take timely actions and be on top of the game without missing a beat.
Some of the key highlights of this product are;
- 360-degree View of CRM Data: Normal grid view of CRM data is quite difficult to analyze. With Map My Relationships, you get a 360-degree view of entire Relationships & Connections of Dynamic 365 CRM records. This mind map view of relationships and connections makes it easier to reach information-based decisions in the nick of time.
- Information at a Glance: A quick summary of each record within the relationship map is made available for ready reference. Further, it provides information on associated entity records in N-level relationships and helps to identify different connection roles through the use of different color legends. This eliminates the need to dig around for information and saves valuable time.
- Analyze Data with ease: The relationship between the records and their associated entity records are made available in a single view. From the number of records, the status of records, the aggregate value of records, etc. everything is available on a single frame which makes it quite easy to analyze data without hopping from one screen to another.
- Easy Configuration across Devices: Map My Relationships can be configured for Web, Mobiles, and Tablets for a unified experience. This allows great mobility and removes restrictions when it comes to the usage of various devices. Place, time, and device are no hindrance for mapping relationships and connections in Dynamics 365 CRM.
With trillions of data generated every day, it becomes mandatory to incorporate data visualization tools to make sense of that data.
It’s time to bid goodbye to all those raw data by implementing data visualization apps like Kanban Board and Map My Relationships into your Dynamics 365 CRM.
But before that, get first-hand experience of the amazing functionalities of these apps by downloading the 15-day free trial from our website or Microsoft AppSource. Also, check out these wonderful videos of Kanban Board & Map My Relationships for a detailed visual analysis.
Drop a mail at crm@inogic.com for any information related to Dynamics 365 CRM data visualization.
Until then – Happy Visualization!