Introduction
The PowerApps is an application development service to build custom and business applications. Using custom business apps, users can connect to data and work on the web and mobile. After the development of business applications, some users want to identify where they are getting the error from or want to just check the performance. For this, Canvas App has introduced the Monitor tool which will provide a way to view the stream of events from the user sessions and help them to diagnose the issues.
In this blog, I have used the Patch request to update the status of the record but somehow it does not seem to be working. To check this issue, I am going to use the Monitor tool.
Note: This command checker can be seen only on the UI.
Working:
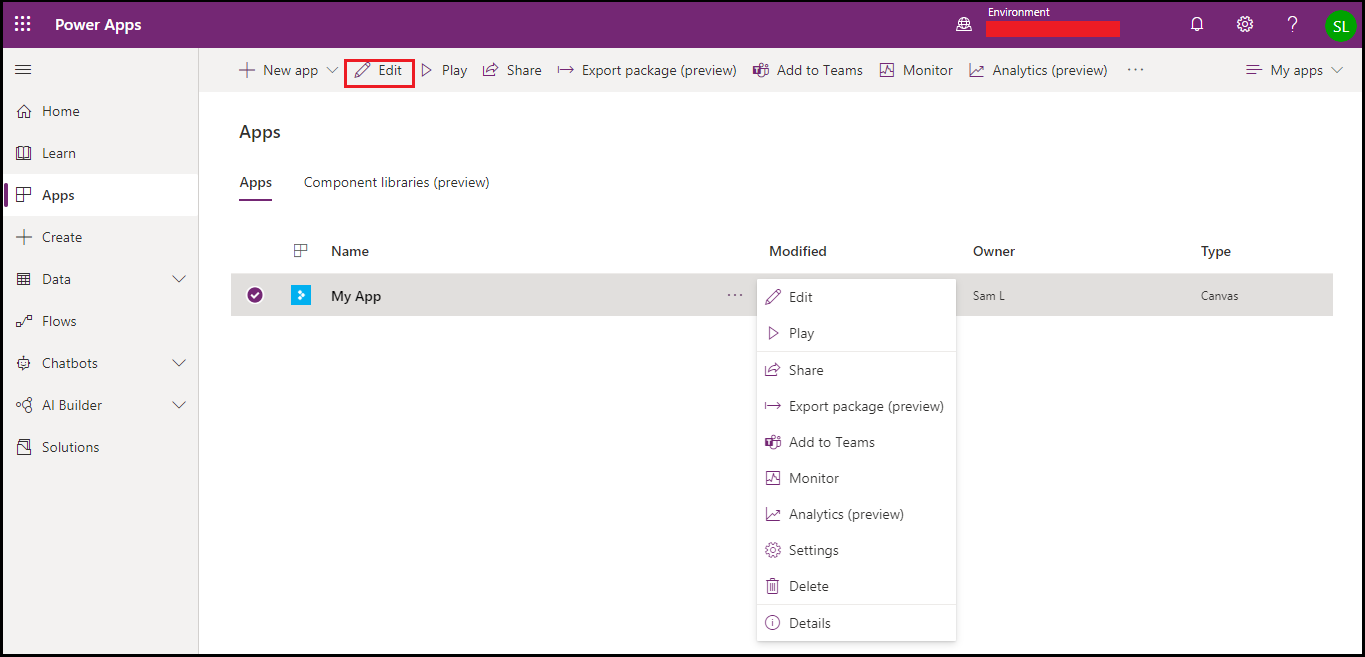
Here, I have created the app ‘My App’. After creating the App, I selected it for editing as shown in the below screenshot:
Here, I have created a ‘Patch’ request to update the status of the record on click of the button, as shown below:
Patch(Accounts,BrowseGallery1.Selected, {Status:’Status (Accounts)’.Inactive})
A plugin is also created to throw errors when the status is updated. Here, I have used the below code to throw errors from the plugin:
thrownewException(“Canvas App error”)
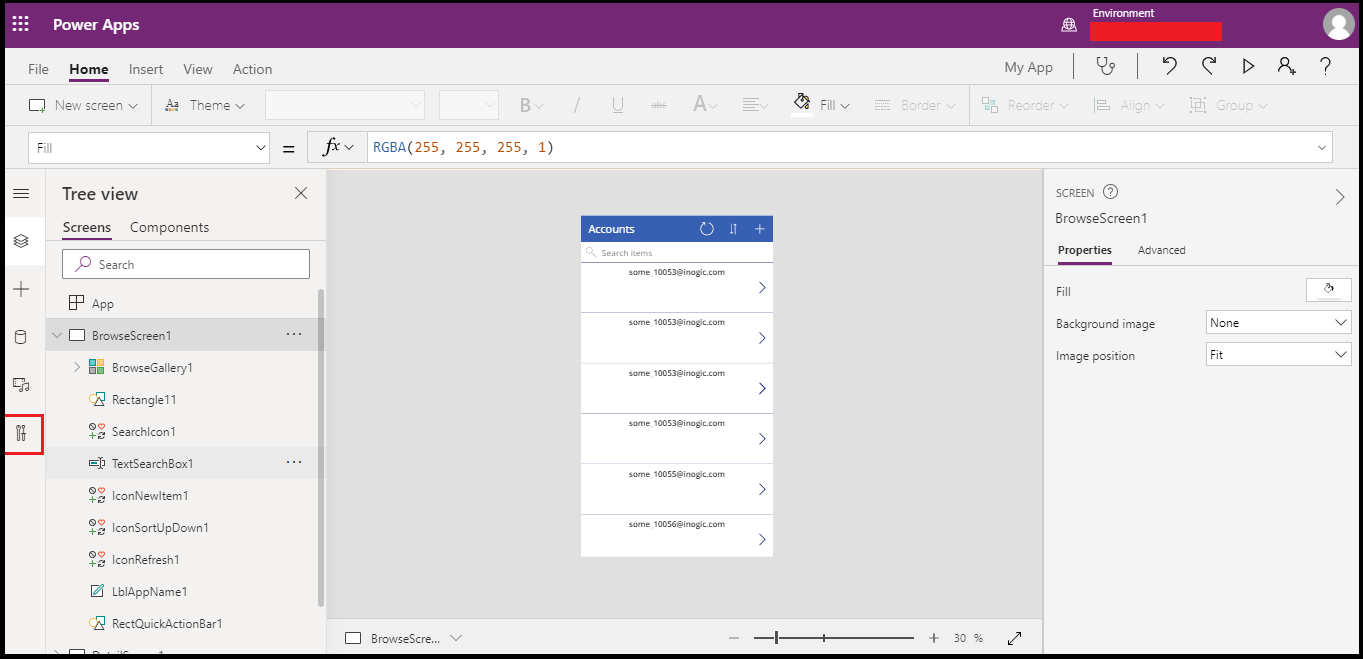
Now to monitor/debug the ‘App’, select the Advanced Tool on the left pane of the App, as shown in the below screenshot:
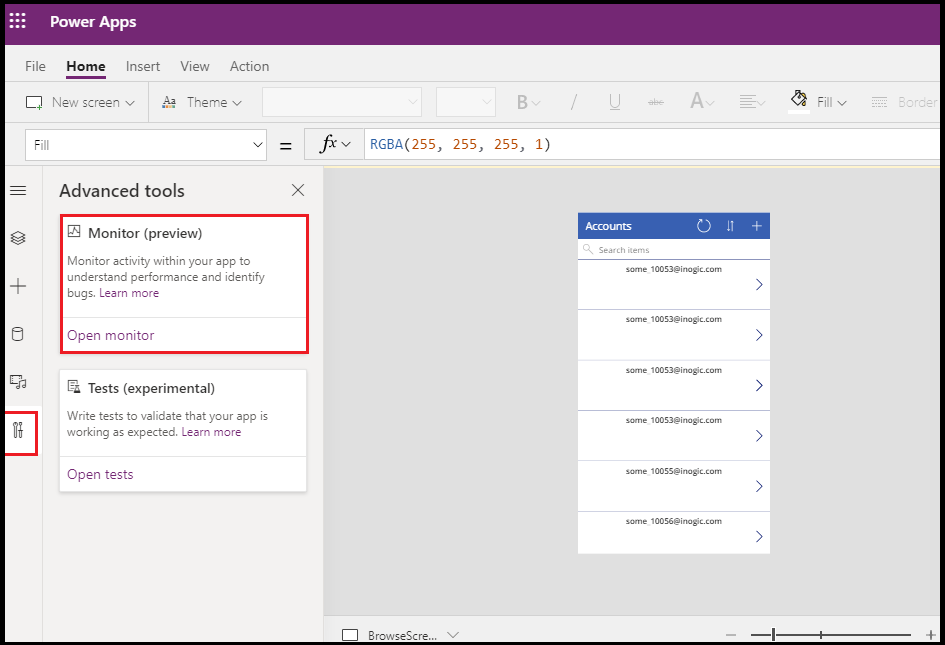
On clicking the ‘Advanced Tool’ icon, it will open the window which will show the Monitor option. Now click on the option ‘Open Monitor’ as shown in the below screenshot:
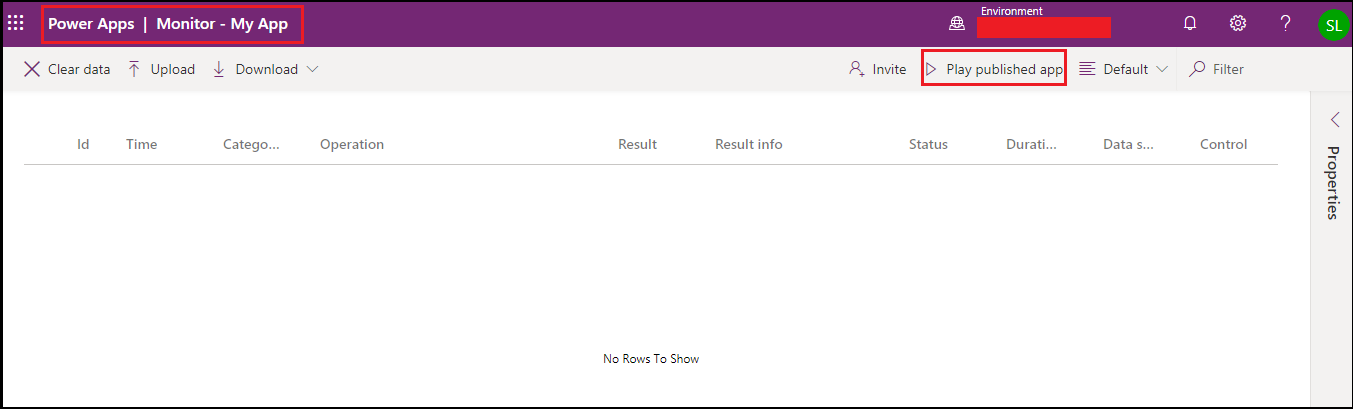
It will open the Monitor page, click on the ‘Play Published App’ as shown in the below screenshot. This will open the published app in a new browser tab and will connect it to the current Monitor session. It will now immediately show events in the Monitor such as loading of the app in the web player and our interactions with the published app.
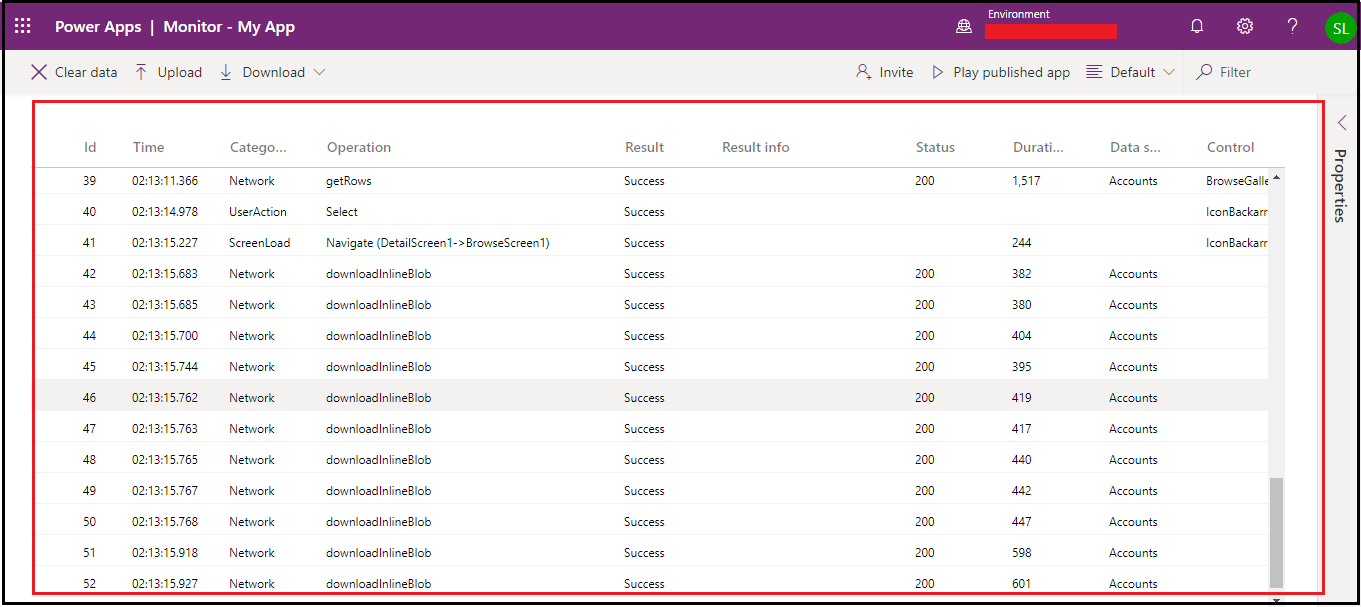
The created events of the user session will be shown as per the below screenshot. In the below sessions, you can see where it’s getting failure, success, and where it’s taking time.
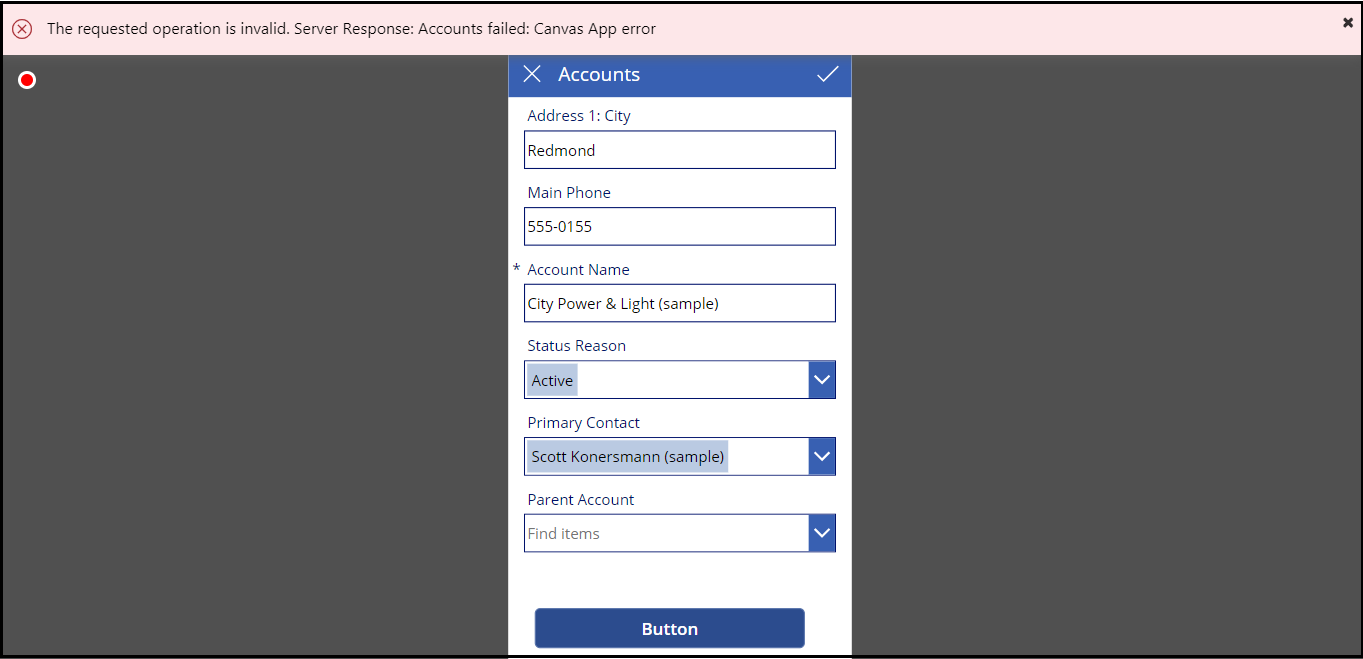
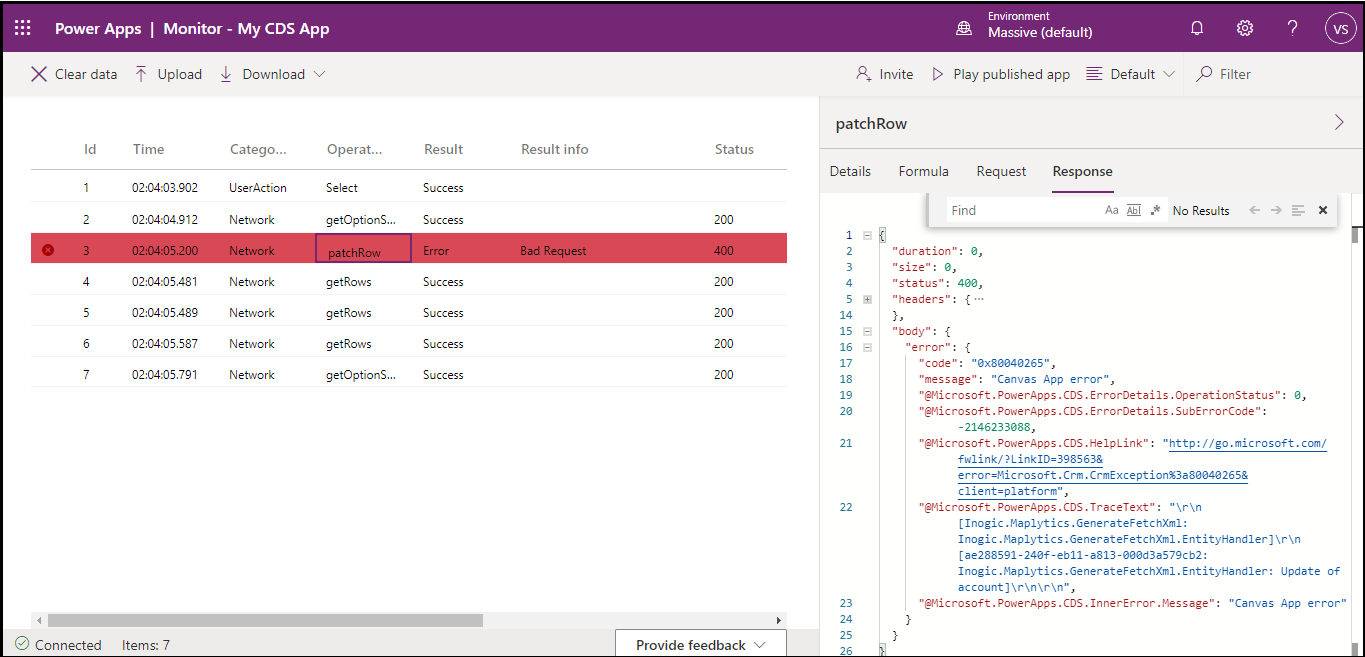
Here, when I get the error, I will click on the Bad request row and then I will be able to monitor from where I am getting the error as shown in the below screenshot:
After monitoring, I removed the plugin for the ‘Account’ entity from where it was purposely throwing the error. And now it is showing a success message.
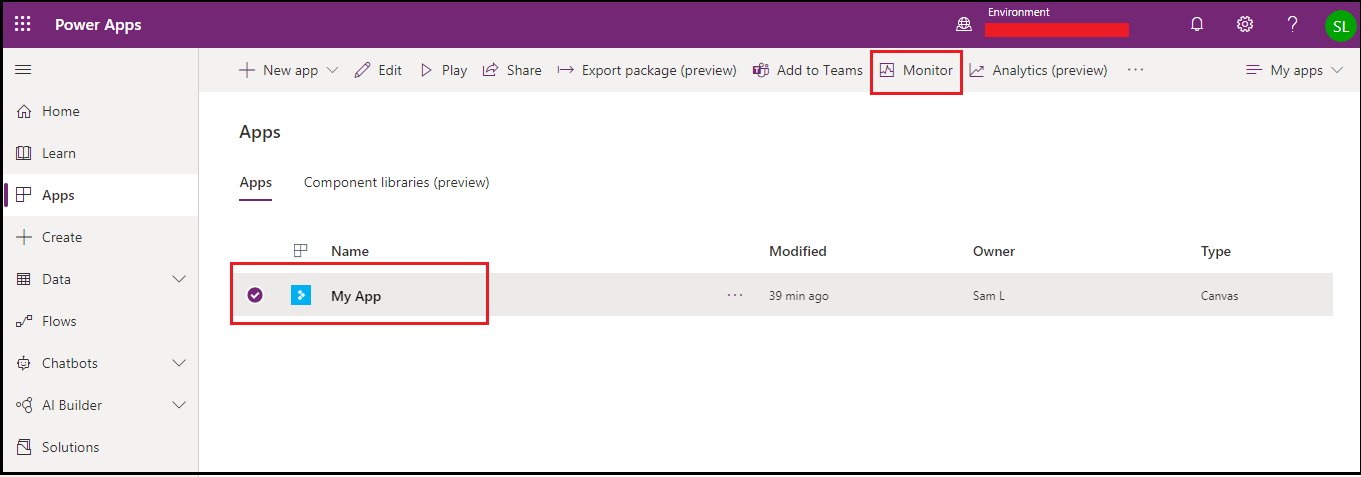
To monitor the Published app, go to the Created Apps page, select the App, and then you will see the Monitor option on the ribbon bar as shown in the below screenshot:
Conclusion
In this way, by using Canvas App Monitor you can easily verify the error in the code and find out why it is not working properly, thereby helping you to rectify the same.