Introduction:
Microsoft Power BI is a powerful tool used for data analysis and reporting using data from different sources, for instance, Dynamics 365. Sometimes reports demand the use of a filter and recently we had a business requirement to apply a filter based on a column from two data sets.
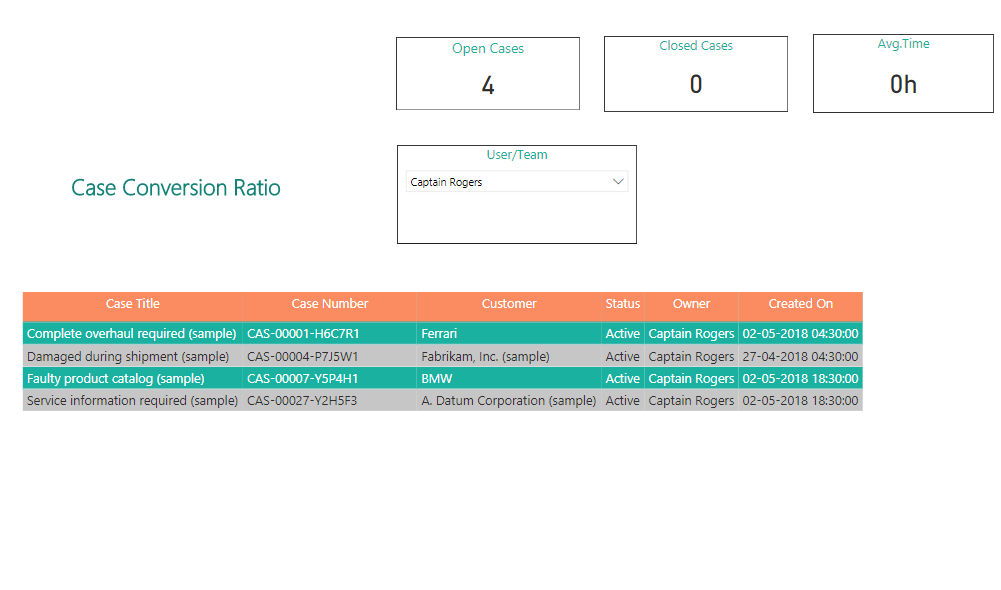
The requirement was to have a dropdown with all the users and teams in CRM. On selection of a specific user or team, the grid view shown below should only display the cases that were owned by either the user or the team selected in the drop-down.
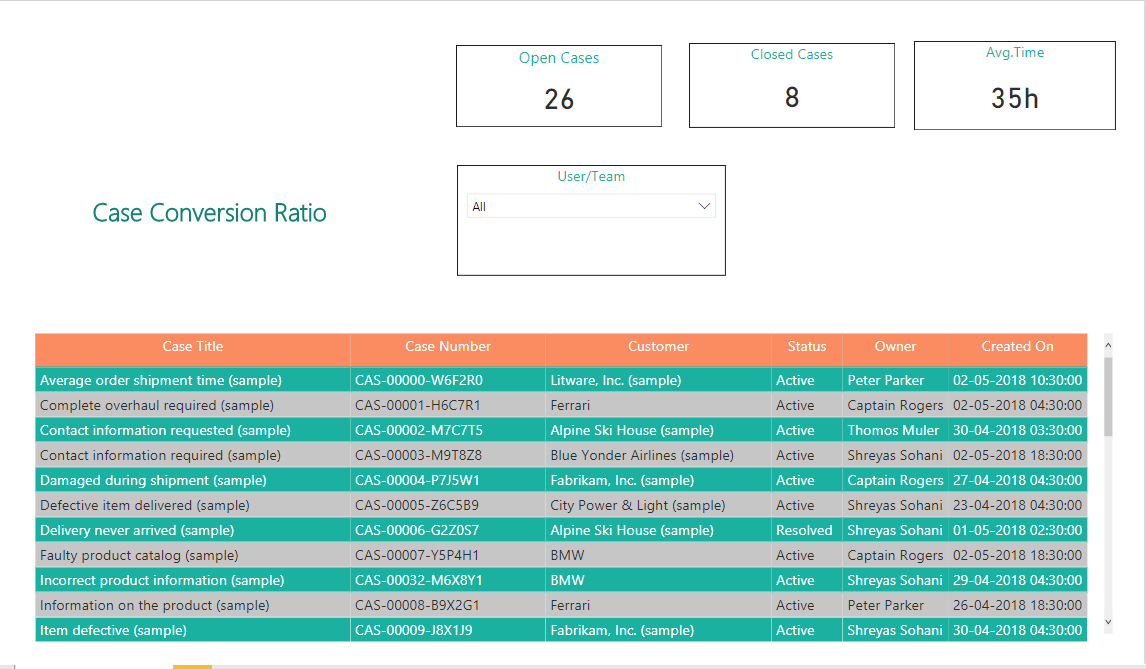
Here the challenge was to club two columns from different datasets in one and show it in a single slicer control. Also, on selection, the respective value should filter the cases in the grid below.
Here are the steps to achieve the same:
1. Create a new dataset (table) which is a UNION of the datasets “systemusers” and “teams”.
Now, select the columns “fullname” and “systemuserid” from the dataset “systemusers” and columns “name” & “teamid” from the dataset “teams”.
Then use following query:
User/Team = DISTINCT(UNION(SELECTCOLUMNS(systemusers,”ID”,systemusers[systemuserid], “Name”,systemusers[fullname]),SELECTCOLUMNS(teams,”ID”,teams[teamid],”Name”,teams[name])))
Note: You can also include other columns as well, but as per our requirement these were the mandatory columns needed.
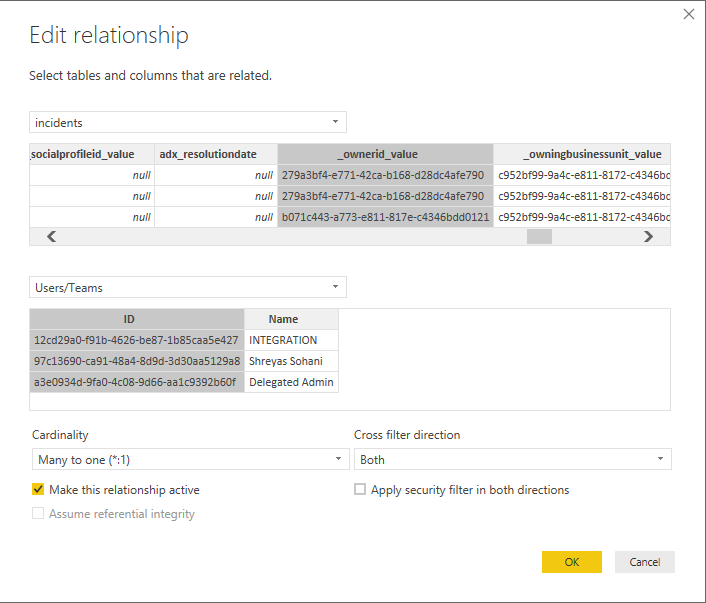
2. Next, Create “N: 1” relationship between the existing Dataset “Cases” and newly created Dataset (i.e., Users/Teams). In this relationship, the primary key would be the “Id” column in the new table (i.e., “User/Teams” table) holding the GUID values of all the users and teams and the Foreign Key would be the “OwnerId” in the “Cases” table.
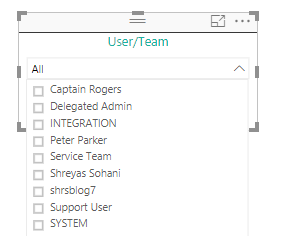
3. Then add Slicer control and select the “Name” column from the newly created table as in the User Interface we are supposed to show the names on the user or the team. However, in the backend, based on the relationship created in step 2, the data will get filtered based on the GUID values.
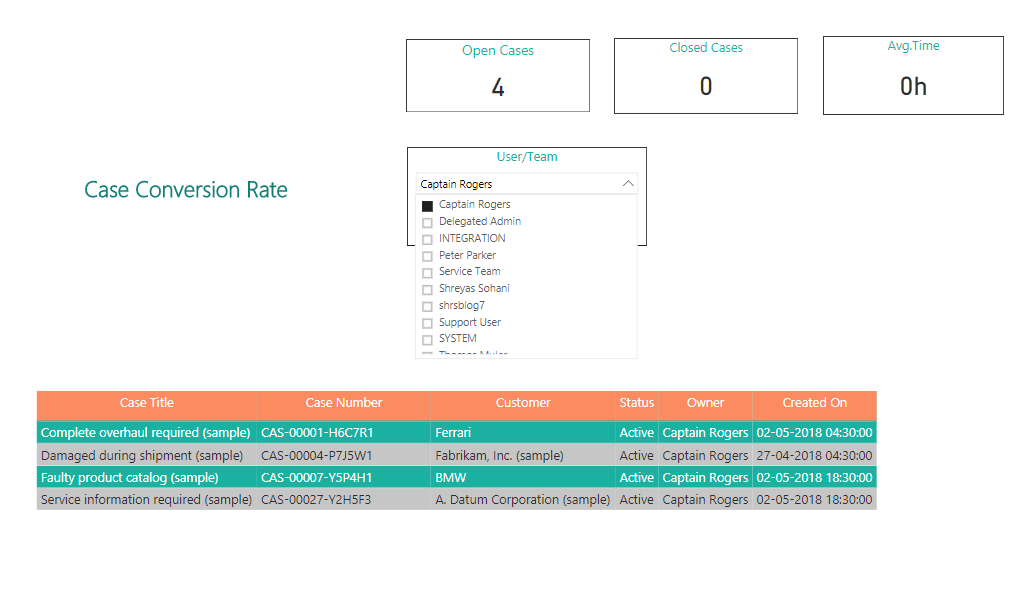
4. Now select the User or Team from the filter, and view the filtered data in the grid view below.
Hope this helps!