 Power Automate has become the backbone for many business processes, integrations, and automation scenarios across the Power Platform ecosystem. From approval processes to large-scale integrations, organisations increasingly rely on cloud flows to power mission-critical workloads.
Although Power Automate provides a comprehensive monitoring experience, one limitation quickly becomes apparent in production environments: cloud flow execution history is retained for only 28 days by default.
For many organisations, this introduces several operational challenges:
- Historical execution data is automatically removed after 28 days
- Troubleshooting failures that occurred months ago becomes difficult
- Long-term trend analysis is not possible
- SLA monitoring and compliance reporting become challenging
- Teams often resort to manual exports before execution history expires
Initially, organisations attempt to overcome these limitations through manual exports, Power BI snapshots, or custom logging implementations. While these approaches provide temporary visibility, they often increase maintenance overhead and introduce fragmented monitoring experiences.
To address this challenge, Microsoft introduced Cloud Flow Run Metadata in Dataverse, allowing organisations to persist cloud flow execution information beyond the default retention period.
In this article, we’ll explore how to extend the default flow run retention period using FlowRunTimeToLiveInSeconds, retrieve Cloud Flow Run Metadata from Dataverse, and build a lightweight dashboard for monitoring flow health and execution success rates.
Approach
Rather than relying solely on the Power Automate portal for short-term diagnostics, we can leverage Cloud Flow Run Metadata stored in Dataverse to build a historical monitoring solution.
Our approach consists of three steps:
- Inspect the current retention period.
- Update FlowRunTimeToLiveInSeconds to extend run history retention.
- Retrieve flow execution metadata and surface it within a custom dashboard.
The dashboard presented in this article intentionally focuses on four key operational metrics:
| Metric | Description |
| Total Runs | Count of all runs |
| Successful Runs | Status = Succeeded |
| Failed Runs | Status = Failed |
| Success Rate | Successful Runs ÷ Total Runs |
While simple by design, this dashboard serves as a foundation that organisations can later enhance with trend analysis, SLA reporting, execution duration insights, and failure analytics.
Understanding FlowRunTimeToLiveInSeconds
Power Platform exposes an organization-level setting named FlowRunTimeToLiveInSeconds, which controls how long Cloud Flow Run Metadata is retained.
By default, this value is:
2419200 seconds
Which corresponds to:
28 days
Before modifying this setting, we can retrieve the current value from the Organization table.
const response = await fetch(
"/api/data/v9.2/organizations?$select=organizationid,flowruntimetoliveinseconds"
);

const data = await response.json();

console.log(data.value[0]);
Example response:
{
"organizationid":"0423e7e6-374c-f111-b31d-6045bdaacfdb",
"flowruntimetoliveinseconds":2419200
}
Extending Cloud Flow Retention
Once the Organization Id is available, the retention period can be updated using a PATCH request.
For example, the following updates the retention period to 14 days.
await fetch(`/api/data/v9.2/organizations(${orgId})`, {

method: "PATCH",

body: JSON.stringify({

flowruntimetoliveinseconds: 7776000

})

});
Organisations can select a retention period that aligns with their monitoring and reporting requirements.
| Retention | Seconds |
| 28 Days | 2419200 |
| 60 Days | 5184000 |
| 90 Days | 7776000 |
| 180 Days | 15552000 |
Retrieving Cloud Flow Run Metadata
Once retention has been configured, we can go ahead and retrieve Cloud Flow Run Metadata available through the flowruns table.
For this dashboard, we only retrieve the fields required for reporting purposes.
const query =
"flowruns?$select=workflowid,status,createdon,duration";

const response = await odata(query);
These columns provide enough information to calculate the dashboard metrics.
| Column | Purpose |
| workflowid | Associated cloud flow |
| status | Succeeded / Failed |
| createdon | Execution timestamp |
| duration | Runtime duration |
Aggregating Flow Metrics
Rather than querying aggregate values individually, the dashboard computes metrics client-side after retrieving flow runs.
For example:
flowMap[wfId].total++;

if (r.status === "Succeeded")
{
flowMap[wfId].success++;
}
Success percentage can then be derived using:
const rate = (success / total) * 100;
Failures are calculated as:
const failures = total - success;
This provides enough information to surface the four dashboard KPIs.
- Total Runs
- Successful Runs
- Failed Runs
- Success Rate
Building the Dashboard
To visualise Cloud Flow Run Metadata, we created a lightweight HTML web resource.
The dashboard displays Total Runs, Successful Runs, Failed Runs and Success Rates
along with a simple breakdown of individual cloud flows, including:
- Success percentage
- Average execution duration
- Number of failures
- Last execution date
Dashboard Output
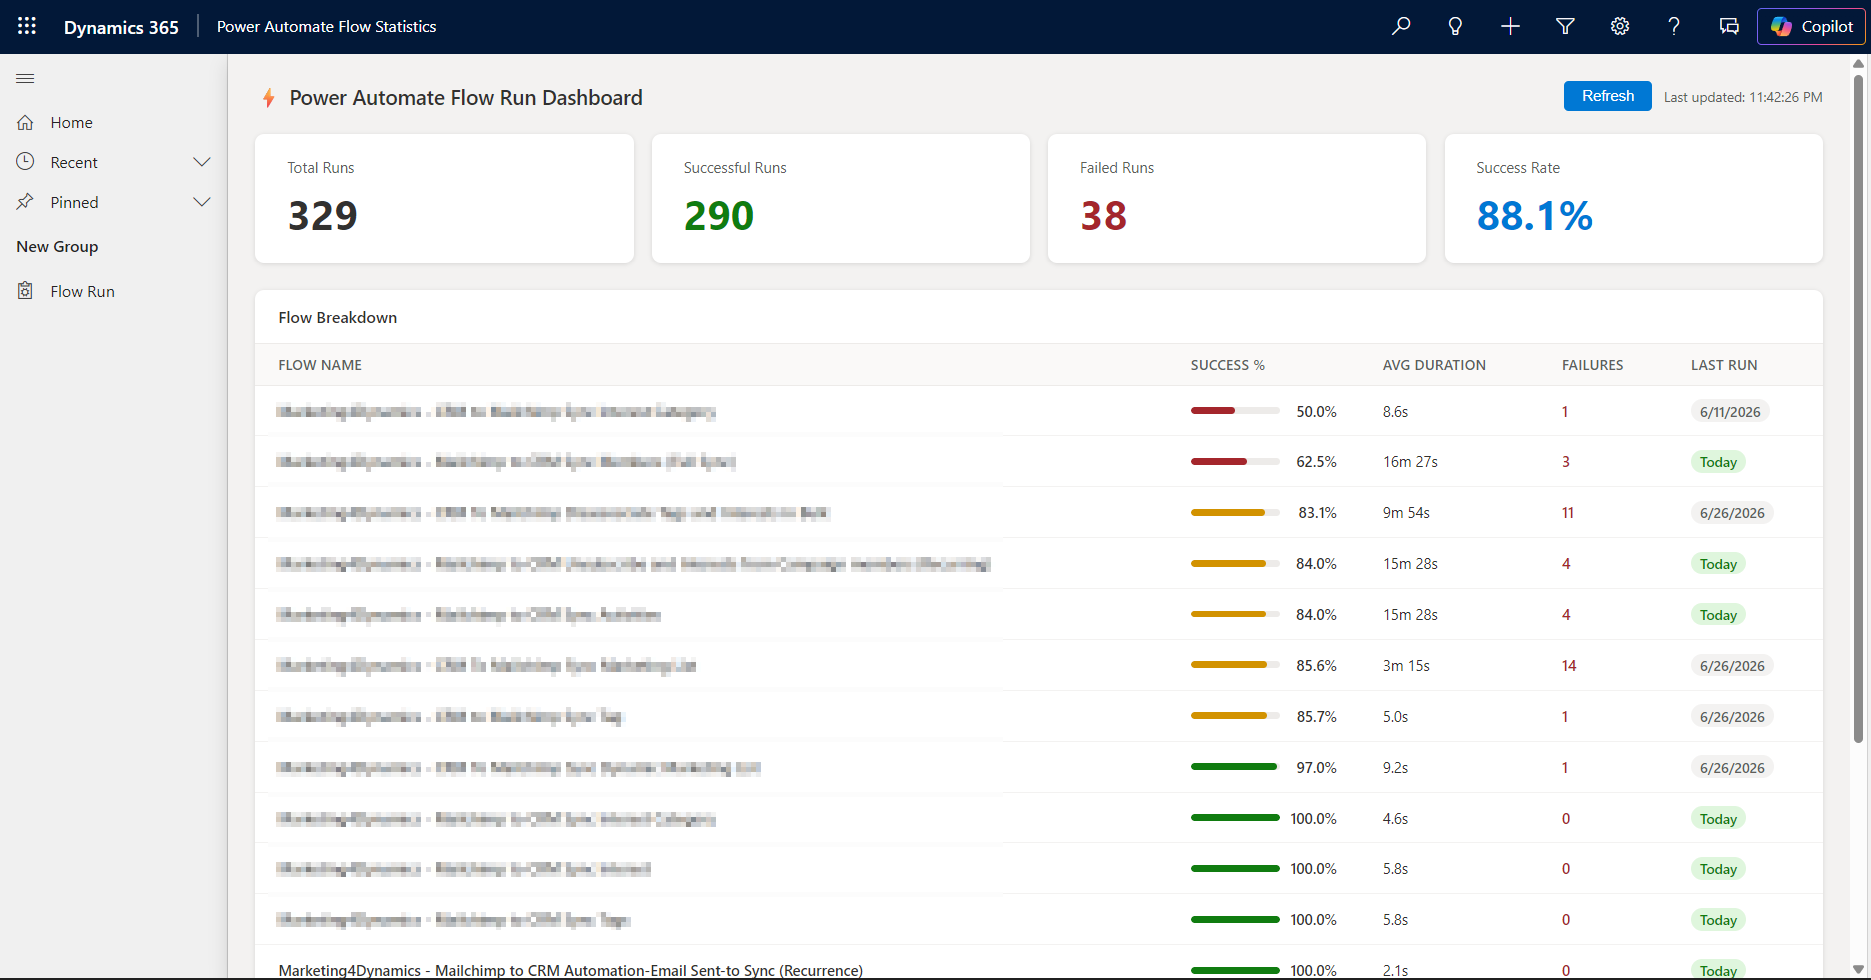
Figure 1: Power Automate Flow Dashboard
Conclusion
Although Power Automate provides excellent short-term monitoring capabilities, the default 28-day retention period can become a limitation for organisations operating business-critical automations.
By leveraging FlowRunTimeToLiveInSeconds together with Cloud Flow Run Metadata stored in Dataverse, organisations can retain execution history for longer periods, simplify troubleshooting, and build monitoring experiences tailored to their operational requirements.
The dashboard presented in this article focuses on four essential metrics, but the same metadata can easily be extended to support:
- SLA monitoring
- Historical trend analysis
- Capacity planning
- Failure analytics
- Operational insights
- Enterprise-scale Power Platform governance
For organisations seeking deeper visibility into their automation landscape, Cloud Flow Run Metadata provides a practical foundation for long-term monitoring beyond the limitations of the Power Automate portal.
FAQs
What is the default run history retention period in Power Automate?
Power Automate retains cloud flow run history for 28 days by default. This is controlled by an organization-level setting called FlowRunTimeToLiveInSeconds, which is set to 2,419,200 seconds (28 days) out of the box.
Where is Cloud Flow Run Metadata stored?
Cloud Flow Run Metadata is stored in Dataverse, in a table called flowruns. Key columns include workflowid (the associated flow), status (Succeeded/Failed), createdon (execution timestamp), and duration (runtime).
Can I build a custom dashboard for Power Automate flow monitoring?
Yes. By querying the flowruns table in Dataverse, you can build a lightweight HTML web resource or Power BI dashboard that surfaces metrics like Total Runs, Successful Runs, Failed Runs, and Success Rate, calculated client-side from the retrieved run data.
What can Cloud Flow Run Metadata be used for beyond basic monitoring?
Beyond the four core KPIs, the same metadata can support SLA monitoring, historical trend analysis, capacity planning, failure analytics, and enterprise-scale Power Platform governance.