 Key Takeaways
- See a 360-degree Dynamics CRM relationship view instead of navigating through related records individually.
- Follow N-Level Relationships to understand how connections extend across your Dynamics 365 data.
- Add context to visual Dynamics 365 relationship mapping with roles, labels, images, grouping, and record details.
- Filter the map to focus on the Dynamics 365 relationships that matter.
- Explore the connections and take action from the same view by creating, connecting, or working with related records.
Introduction
Open an account in Dynamics 365 CRM and you will find its contacts, opportunities, activities, connections, and other related records. But the moment you need to understand how those records relate to one another, the familiar list of related records starts to feel limiting.
The problem is not the amount of data. It is the relationship between the data.
One contact may be connected to an opportunity. That opportunity may lead to another record. A connection may identify a particular role. Going through these relationships one record at a time can make the bigger structure difficult to hold in view.
Map My Relationships brings that structure into a visual workspace through Mind Map Visualization. Instead of looking at Dynamics 365 CRM relationships as separate entries, users can start with a record and expand the connections around it.
Dynamics CRM Relationship View: See What Sits Around the Record
A Dynamics CRM relationship view usually answers a straightforward question: What records are related to this one?
Mind Map Visualization lets users take that a step further.
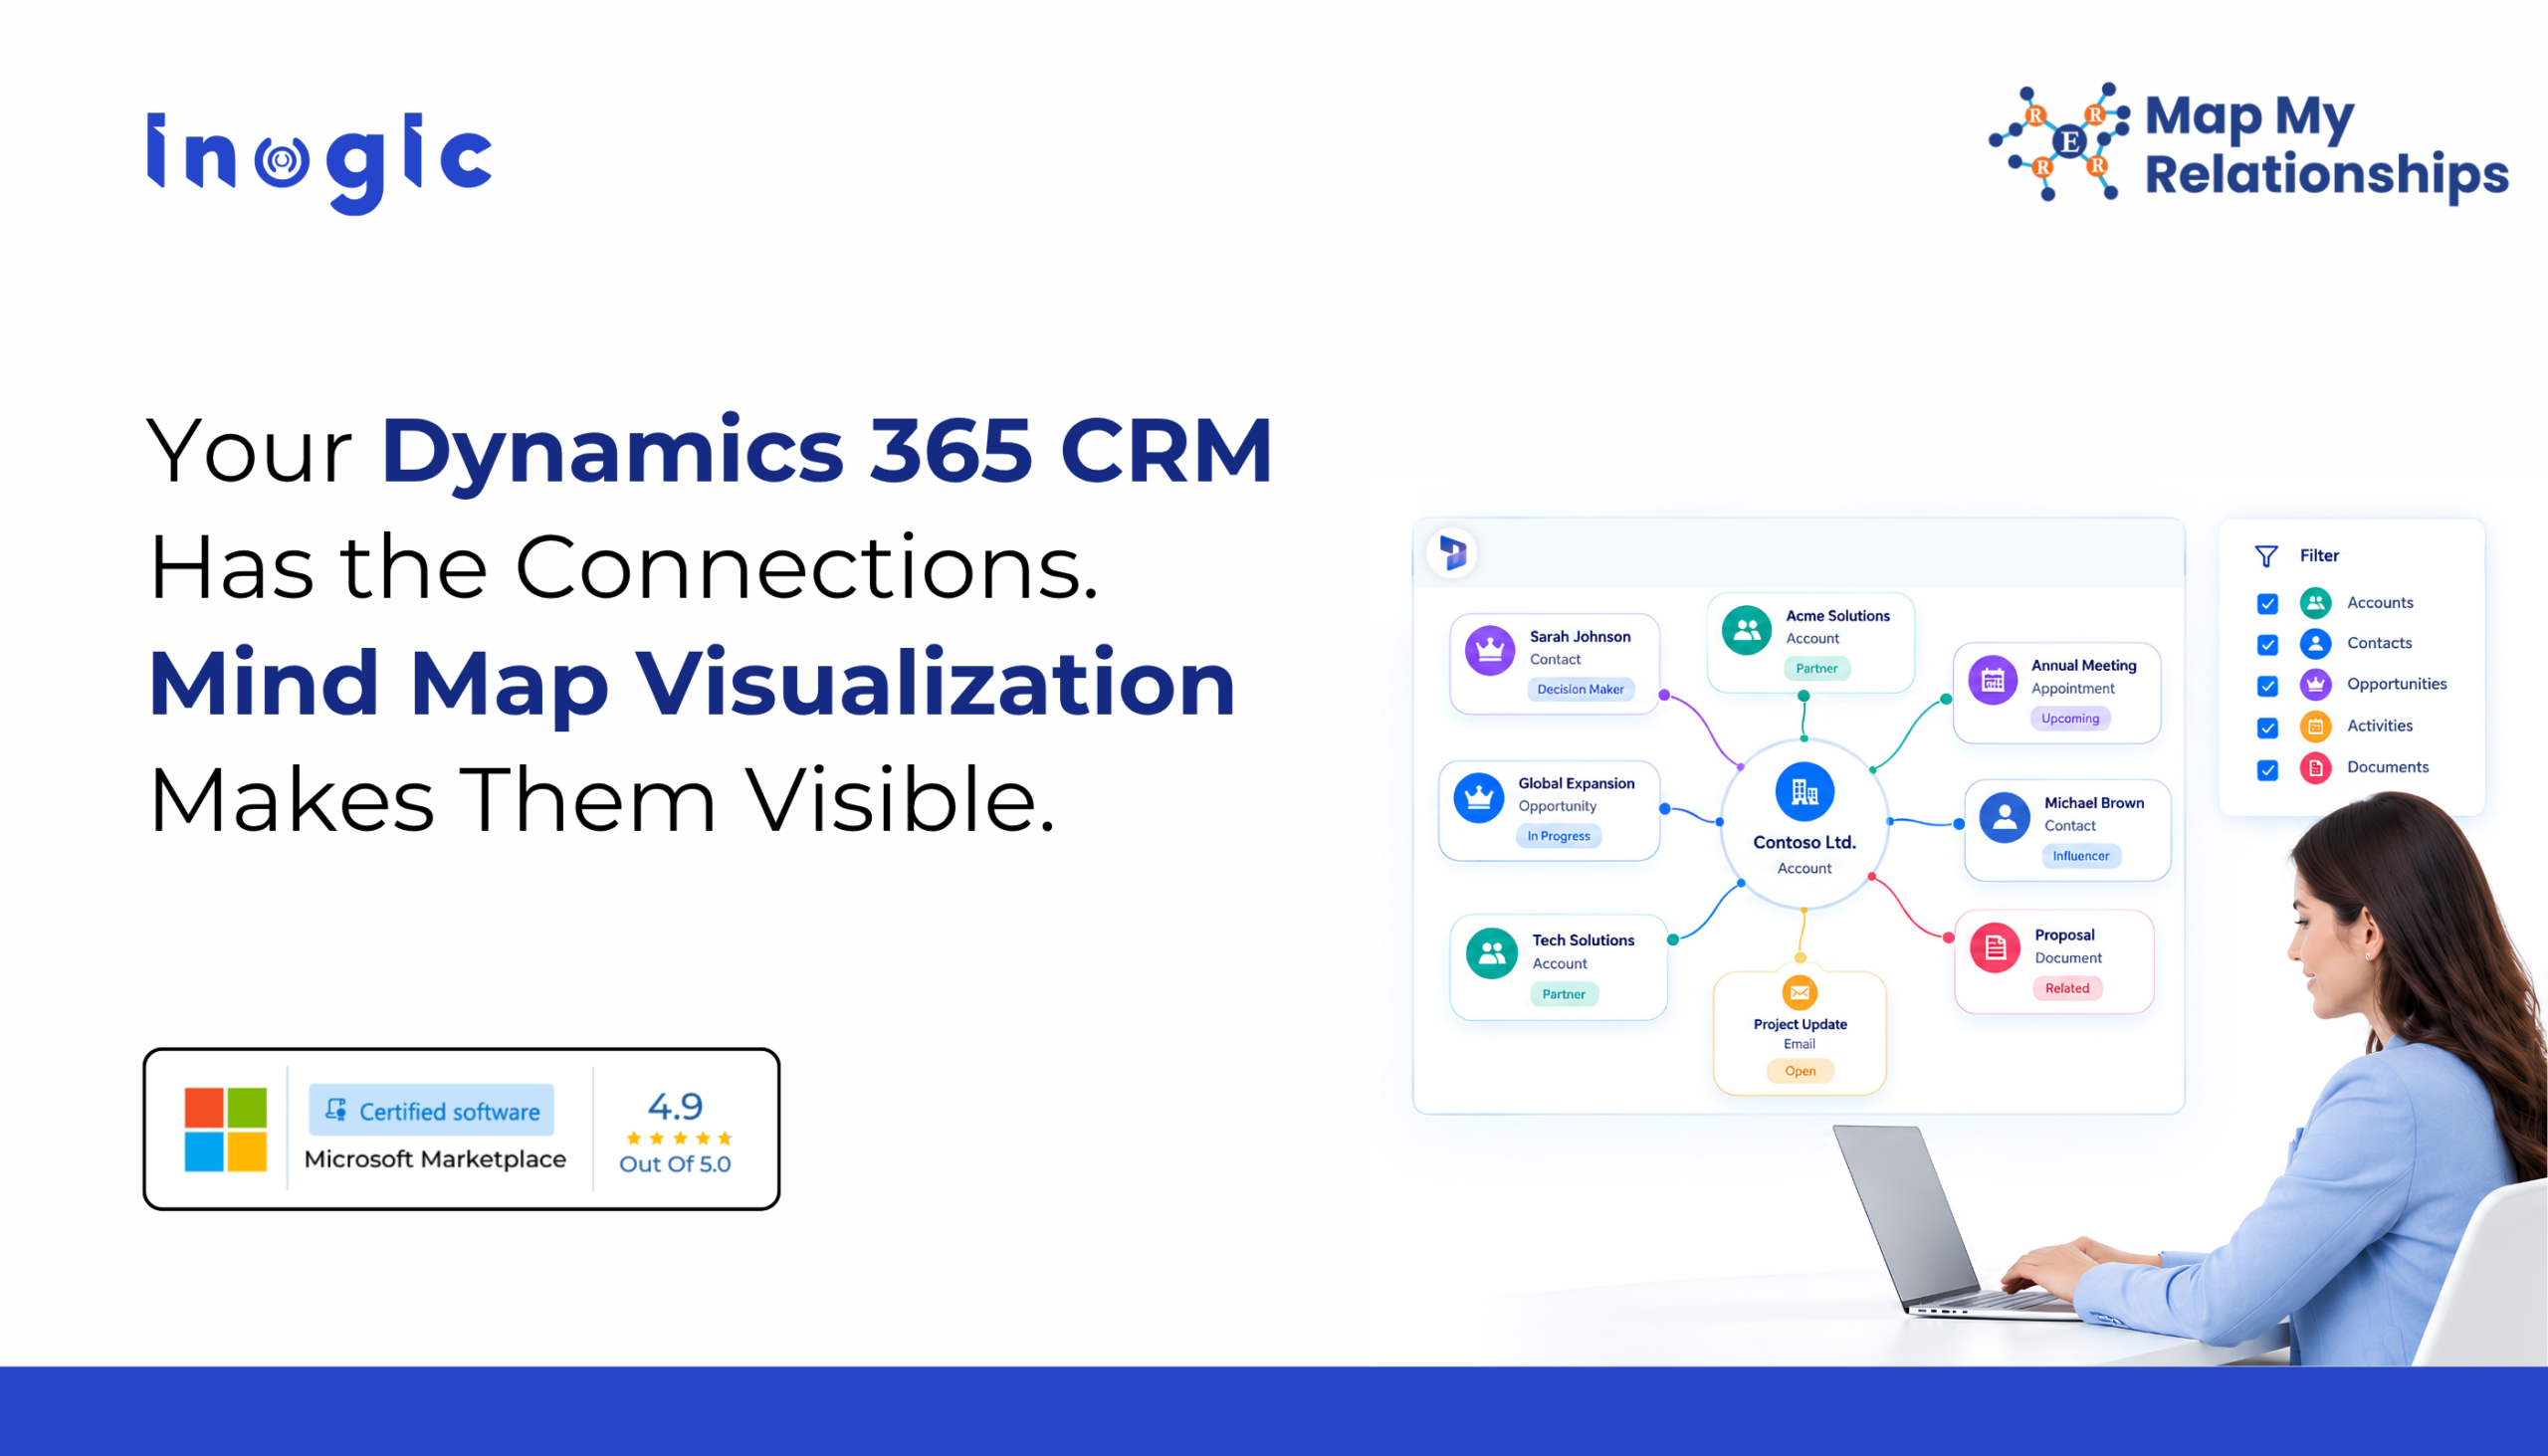
The selected record becomes the starting point of a 360-degree relationship view, with connected records displayed around it. Nodes can be automatically expanded, and N-Level Relationships allow users to continue through additional levels.
For an account relationship map in Dynamics 365, this means the account does not have to remain the end point of the search. Users can follow the connections around it and see how the surrounding records fit together.
The core of relationship mapping in Dynamics 365 is following the connections rather than repeatedly starting a new search from another record.
Visual Dynamics 365 Relationship Mapping: Give Every Connection Some Context
Displaying more records creates another challenge. A map can contain plenty of information and still be difficult to read.
Mind Map Visualization provides several ways to give that information context. Color-coded connection roles can distinguish relationships, while custom labels, images, and record details help users understand what each node represents. Grouping and aggregation provide additional ways to organize information within the map.
This is also where a relationship map differs from a conventional org chart in Dynamics 365, hierarchy view, or tree view chart in Dynamics 365. A hierarchy can show where records sit in a structure. A relationship map can show what they are connected to around that structure.
For teams working with stakeholder or account relationships, that distinction matters. The objective is not simply to create an attractive diagram. It is to make the Dynamics 365 relationship easier to follow.
View Connections in Dynamics 365 and Act on What You Find
The map does not have to be the end of the navigation.
Users can filter records, view relationships as a table, connect records, and create associated records directly from the visualization. Quick actions support activities such as emails, tasks, phone calls, and appointments.
The Mind Map also supports Spider View, image download, and Custom Page. The latter can open the visualization from Dynamics 365 CRM grids or forms when a larger workspace is useful.
So Dynamics 365 data visualization stays connected to the underlying CRM work. You can inspect the relationship, narrow the map, open the relevant record, or take an action without treating the visualization as a separate destination.
Conclusion
A related-record list tells you what is connected. A relationship map lets you see how the connections sit around the record.
That is the practical role of Mind Map Visualization in Dynamics 365 CRM. With Map My Relationships, users can move from an individual record to its wider relationship structure, explore multiple levels, understand the context around connections, and act on the records they find.
For anyone looking to visualize Dynamics 365 relationships rather than navigate them one at a time, that change in perspective can make the CRM structure considerably easier to read.
FAQs
What does Mind Map Visualization do in Dynamics 365 CRM?
It provides a visual way to explore relationships and connections between Dynamics 365 CRM records, including Accounts, Contacts, Opportunities, and custom entities.
Can Mind Map Visualization show N-Level relationships in Dynamics 365 CRM?
Yes. It supports N-Level Relationships, allowing users to explore connected records across multiple relationship levels.
Can I filter a Dynamics 365 relationship map?
Yes. Users can filter the records displayed in the Mind Map to focus on the relevant information.
Can I take actions from the Mind Map?
Yes. Users can create associated records, connect records, and perform quick actions such as emails, tasks, phone calls, and appointments.
How is Mind Map Visualization different from a hierarchy view in Dynamics 365?
A hierarchy view in Dynamics 365 CRM primarily represents hierarchical structure. Mind Map Visualization is designed to explore broader relationships and connections around a CRM record.