Imagine building a sales dashboard where managers need to track key figures like Total Revenue, Open Opportunities, and Pending Requests briefly. Displaying these metrics in well-designed cards makes business performance easier to understand.
Traditionally, creating such cards in Canvas Apps requires combining multiple controls and manually adjusting their fonts, colors, spacing, and alignment.
The new Metrics Card modern control simplifies this process by allowing makers to display a title, headline value, description, and optional trend indicator using a single control. It also automatically adapts to the app’s theme.
In this blog, we’ll explore Metrics Card modern control key properties and build a practical KPI dashboard using live data, along with its limitations and important considerations.
Quick Summary
- The metrics card is purely visual. Your formulas produce the numbers, and the card shows them.
- The headline value is a text field, so convert numbers with Text().
- Whether a KPI trend looks good or bad is your decision, set through TrendType.
- Add an OnSelect formula and the card becomes a tap target.
- Because the feature is in preview, avoid production use for now.
What’s New and Why It Beats Hand-Built Tiles
The Metrics Card replaces a stack of separate shapes and labels with one control that already handles layout, styling, trend display, and accessibility.
| Area | Hand-built tile | Metrics Card |
| Setup | Rectangle, labels, and icon grouped and copied for every KPI | One control per KPI |
| Consistency | Spacing, fonts, and colors aligned manually | Fill, border, and accent strip follow the app theme |
| Trend indicator | Build your own badge and color logic | Built-in badge with automatic +/− sign and TrendType meaning |
| Empty values | Handle each blank case yourself | Blank title or description hides itself; blank value shows a dash |
| Sizing | Resize each element | AutoHeight and Overflow handle longer content |
| Interaction | Wire up the click on the group | OnSelect on the card itself |
| Accessibility | Label each piece by hand | Reading generated automatically, or set your own with AccessibleLabel |
| Styling freedom | Full control over every element | Limited: no separate trend font or per-field text colors |
Two things stay the same: you still write the Power Fx that calculates the number and decides what counts as good or bad. The card removes the layout work, not the logic. The card is also in preview, which hand-built tiles are not.
How the Metric Card Works
Think of the Metrics Card as a display surface. It won’t sum up a column, compare this month to last month, or decide whether a change deserves a green or red badge. You prepare those results with Power Fx, then pass them into the card’s properties.
Content properties
This table explains the Content properties of the Metrics Card modern control in Power Apps. Each property controls a different part of the KPI card.
| Property | Role |
| Title | The label for the KPI. Leave it empty, and the label disappears. |
| DisplayText | The headline figure. If it’s empty, the card shows a dash rather than 0. |
| Description | A line of context beneath the figure, like a date range or region. |
| TrendValue | The change amount shown in the badge, with its +/− sign added automatically. Use Blank() to remove the badge. |
| TrendText | A short phrase next to the badge. It can stay visible even without a badge. |
| TrendType | MetricCardTrendType.Positive.Negative or Neutral, which sets the badge’s look and meaning. |
The badge shows a bare number, so add any % or currency symbol through TrendText.
Layout, interaction and styling
These properties show how you can customize the appearance, size, interaction, and overall styling of the Metrics Card modern control in Power Apps.
- OnSelect and DisplayMode: a click action runs only when DisplayMode is Edit. In View or Disabled mode, the card is display-only.
- Sizing: Cards start at 250 wide and 200 tall. Enable AutoHeight to let the card fit its content.
- Overflow: In a fixed-height card, extra content is cut off by default. Switch to Scroll to make it reachable.
- Accent strip: HighlightPosition and HighlightColor place and color the strip. The strip sits at the top by default.
- Surface: Fill, border settings, corner radii, and DropShadow shape the card’s overall look.
- Typography: The title, headline value, and description each have their own font, size, weight, and italic settings.
Hands-On: An Expense Dashboard
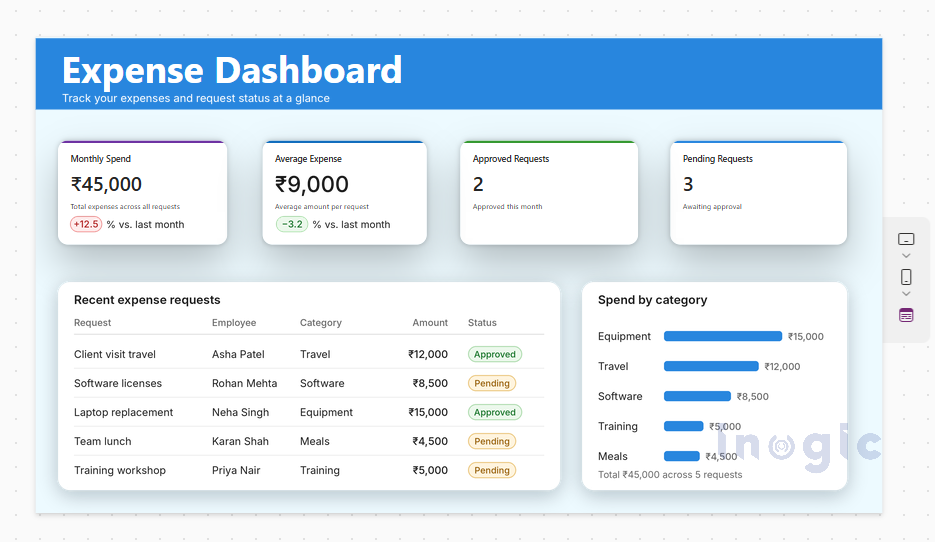
This hands-on section demonstrates how to build an Expense Dashboard using the Metrics Card modern control in Power Apps, connected to a SharePoint list called expense requests
We’ll use a SharePoint list named expense requests to create two tiles: one for monthly spend with a trend, and one for pending requests that opens another screen.
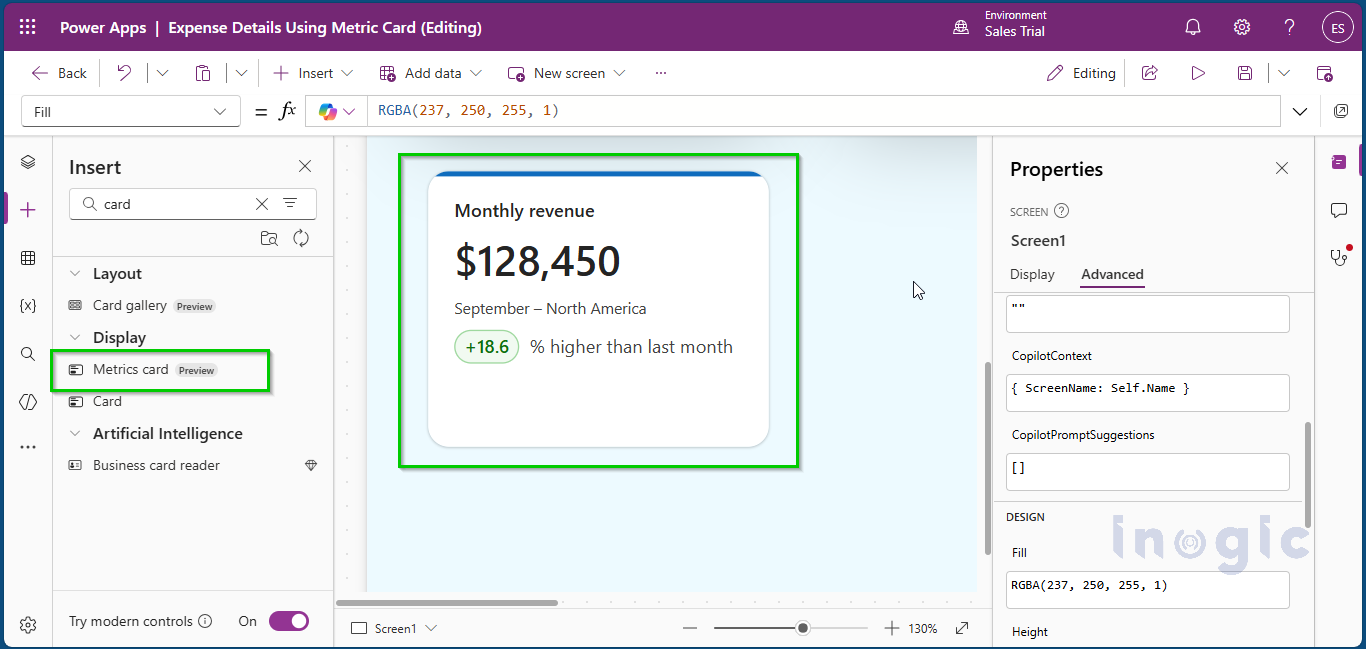
Step 1: Insert the control
In this step is you will add the Metrics Card to your Canvas App.
- Open your app in Power Apps Studio and go to the dashboard screen.
- From the Insert pane, choose Metrics Card under modern controls.
- Rename it SpendMetric, and replace the placeholder sample text as you go.
Step 2: Compute the numbers
Before displaying the figures, you need to calculate them using Power Fx formulas.
The example creates two calculations:
- ThisMonthTotal
- LastMonthTotal
Put the calculations in App > Formulas so they live in one place:
ThisMonthTotal = Sum(
Filter('expense requests', Created >= Date(Year(Today()), Month(Today()), 1)),
Amount
);

LastMonthTotal = Sum(
Filter(
'expense requests',
Created >= DateAdd(Date(Year(Today()), Month(Today()), 1), -1, TimeUnit.Months) &&
Created < Date(Year(Today()), Month(Today()), 1)
),
Amount
);
);
Swap in your own list and column names, and review delegation limits if the list is large.
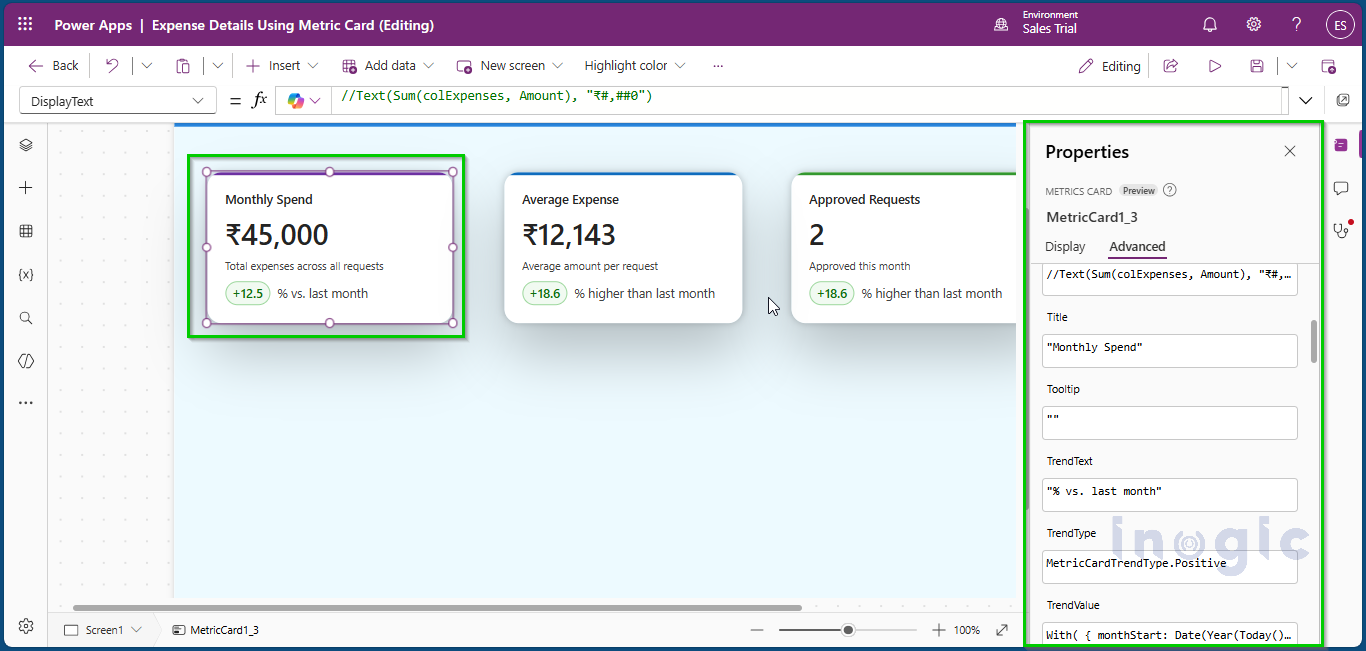
Step 3: Connect the formulas to the card
Now you connect the calculated values to the Metrics Card properties.
Title:       ="Monthly spend"
DisplayText: =Text(ThisMonthTotal, "₹#,##0")
Description: =Text(Today(), "mmmm yyyy") & " - All departments"
TrendValue:  =If(LastMonthTotal = 0, Blank(),
Round((ThisMonthTotal - LastMonthTotal) / LastMonthTotal * 100, 1))
TrendText:   ="% vs. last month"
TrendText:   ="% vs. last month"
Here Text() turns the total into a currency string. When last month has no data, Blank() hides the badge and avoids a divide-by-zero error.
Step 4: Decide what “good” means
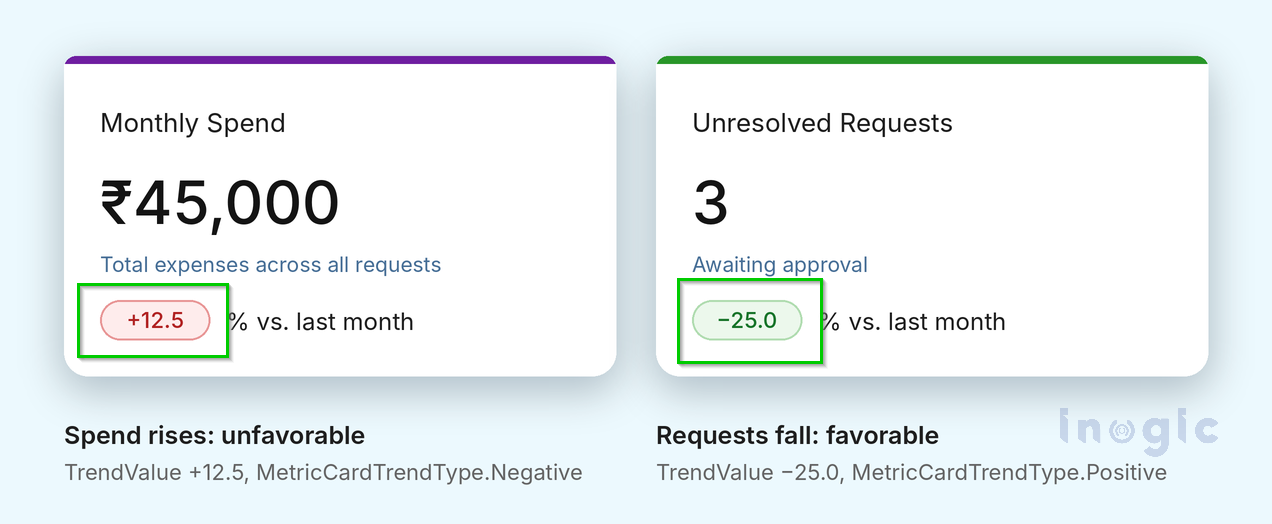
This step determines how the trend should appear based on the KPI. An increase isn’t always positive. More spending is a warning, while more revenue is a win. Since TrendType ignores the number’s sign, you define the meaning:
TrendType: =If(ThisMonthTotal > LastMonthTotal,
MetricCardTrendType.Negative,
MetricCardTrendType.Positive)
MetricCardTrendType.Positive)
The same logic applies in reverse for something like unresolved tickets. A drop in that number is good news, so you’d combine a negative TrendValue with MetricCardTrendType.Positive.
Step 5: A tile with no trend
Now you’ll create the second card to display pending expense requests
Title:       ="Open requests"
DisplayText: =Text(CountRows(Filter('expense requests', Status.Value = "Pending")))
Description: ="Waiting for approval"
TrendValue:  =Blank()
TrendText:   =Blank()
TrendText:   =Blank()
Clear both trend properties. If only TrendValue is cleared, the comparison phrase still appears.
Step 6: Turn the tile into a shortcut
You can make the Open Requests card clickable so users can access the pending requests directly.
OnSelect: =Navigate(PendingRequestsScreen, ScreenTransition.Fade)OnSelect: =Navigate(PendingRequestsScreen, ScreenTransition.Fade)
Leave DisplayMode on Edit. To make a card read-only for certain users, switch it to View.
Step 7: Support assistive technology
This step focuses on making the KPI cards accessible to users who rely on screen readers.
AccessibleLabel provides a spoken description of the card’s information Left empty, AccessibleLabel generates a spoken summary from the card’s visible parts. To control the wording, write your own:
AccessibleLabel: ="Monthly spend is " & Text(ThisMonthTotal, "₹#,##0") &
", " & Text(TrendValue) & " percent compared with last month."
A few more points:
- Set ContentLanguage in multi-language apps. It affects number formatting only, not translation.
- Put key information in visible text or the accessible label, not just the Tooltip.
- Explain the comparison in words so meaning doesn’t depend on color alone.
Design Advice
Recommendations for designing better-looking and more user-friendly Metrics Cards in Power Apps.
- Short titles and specific descriptions read best.
- Use the accent strip to group related KPIs.
- When a fixed-height card holds long text, enable scrolling and test it with mouse and keyboard.
- Preview your cards at different widths, text sizes and languages.
- Keep named formulas like ThisMonthTotal Other controls need the real number, and DisplayText only holds formatted text.
Things to Watch For
limitations of the Metrics Card modern control in Power Apps and the workarounds you can use to handle them
| Issue | Workaround |
| Still in preview | Test in a non-production app and expect changes |
| Value is text, with no automatic formatting | Format with Text() |
| No built-in math or comparison | Calculate in Power Fx |
| Trend sign doesn’t imply good or bad | Always set TrendType |
| Fixed-height cards can cut off content | Use AutoHeight or Overflow.Scroll |
| No separate trend font or per-field text colors | Work within the card’s theme |
Conclusion
The Metrics Card saves makers from rebuilding KPI tiles by hand. You supply the calculations and meaning, and the control takes care of user interface, the trend badge, and accessibility. Try it in a test app today and adopt it in production once Microsoft releases it generally.
Reference: Metrics Card modern control in canvas apps (preview), Microsoft Learn
Faqs
What is the Metrics Card modern control in Power Apps?
The Metrics Card is a modern control in Power Apps Canvas Apps that allows makers to display key performance indicators (KPIs), such as total revenue, monthly expenses, open opportunities, and pending requests. It displays a title, headline value, description, and optional trend indicator in a single card.
How to add a Metrics Card in Power Apps Canvas Apps?
Open your Canvas App in Power Apps Studio, navigate to the Insert pane, and select Metrics Card under modern controls. Add it to your screen and configure its properties, such as Title, DisplayText, Description, and TrendType
Can the Metrics Card automatically calculate KPI values?
The Metrics Card is a visual control and does not perform calculations on its own. You need to use Power Fx functions such as Sum(), CountRows(), and Filter() to calculate KPI values and connect the results to the card.
Can you make a Metrics Card clickable in Power Apps?
You can make a metrics card clikable in power apps by using the OnSelect property to define an action when a user selects the card. For example, use the Navigate() function to open another screen containing detailed information. The card must have its DisplayMode set to Edit for the click action to work.
Can you customize the appearance of the Metrics Card in Power Apps?
You can customize its background, borders, corner radii, drop shadow, accent strip position and color, and typography. These properties help you match the card’s appearance to your Canvas App theme.