Introduction
In the previous article , you saw that we only had the ability to create an org chart forecast and territory forecast. But now while exploring the ‘Sales Forecast’ feature I noticed a new option named ‘create from scratch’.
In this extended blog, we will explore Sales Forecast experience through ‘create from scratch’.
Organizations always have a need to project the revenue generated from various partners through their customers for a given period of time. Now, as we know Account entity in Dynamics 365 CRM can be used for both Partners and Customers as well. So here, when we record the Customer as Account entity then we can set Partner in parent Account lookup field and hierarchy can be accomplished. And further this hierarchy can be used in forecasting feature using custom forecast.
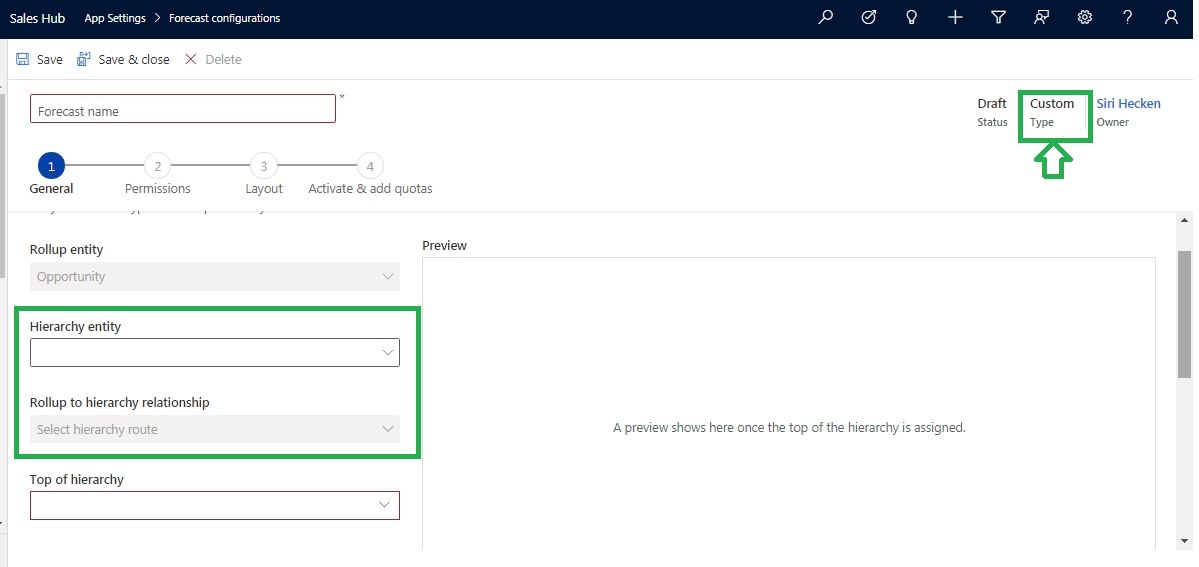
Also it has enabled the facility to select the ‘Hierachy Entity’ and this selection is not just restricted to User entity that we already experienced in the Org Chart type forecast. Here, we have selected Account entity in our case.
Custom foreacast can be used in many scenarios, let us consider one scenario that I implemented. If my organization would like to foreacast or track the opportunities based on the Account selected on Opportunities then I can use custom foreacast by keeping ‘Hierachy Entity’ as Account.
Forecast Configuration steps:
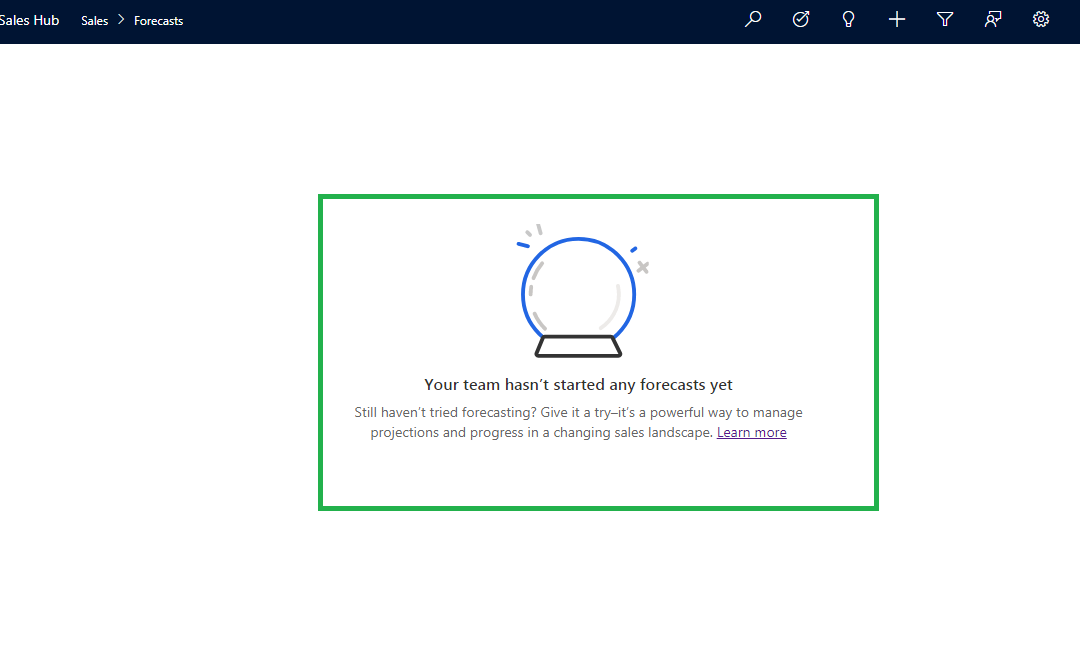
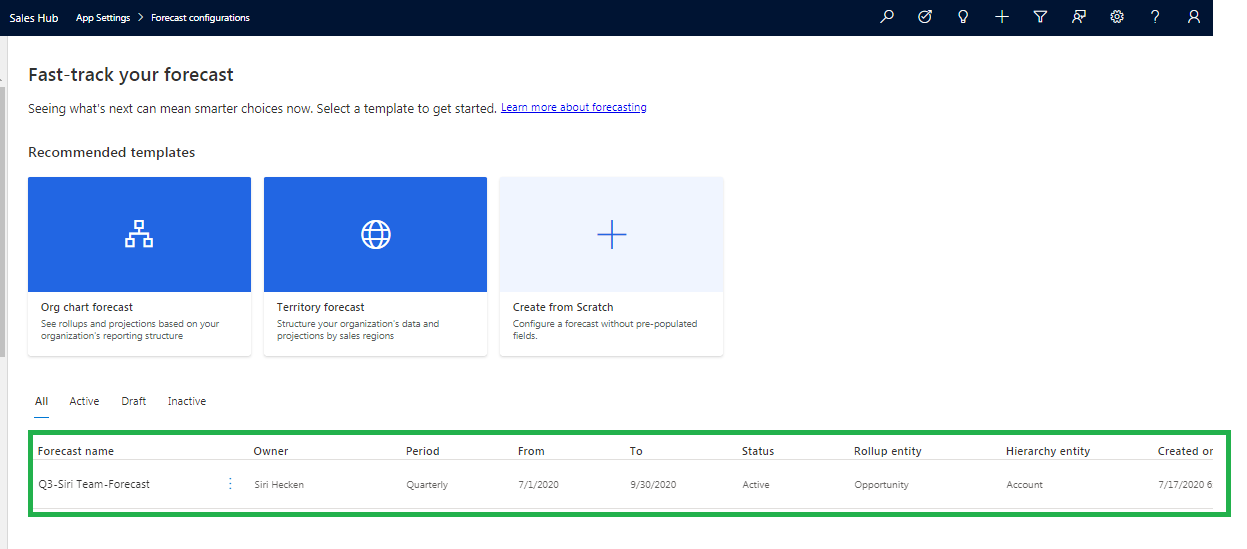
Navigate to Sales–> Forecasts–> If in Dynamics 365 CRM environment there are no forecast configured yet then below screen will appear:
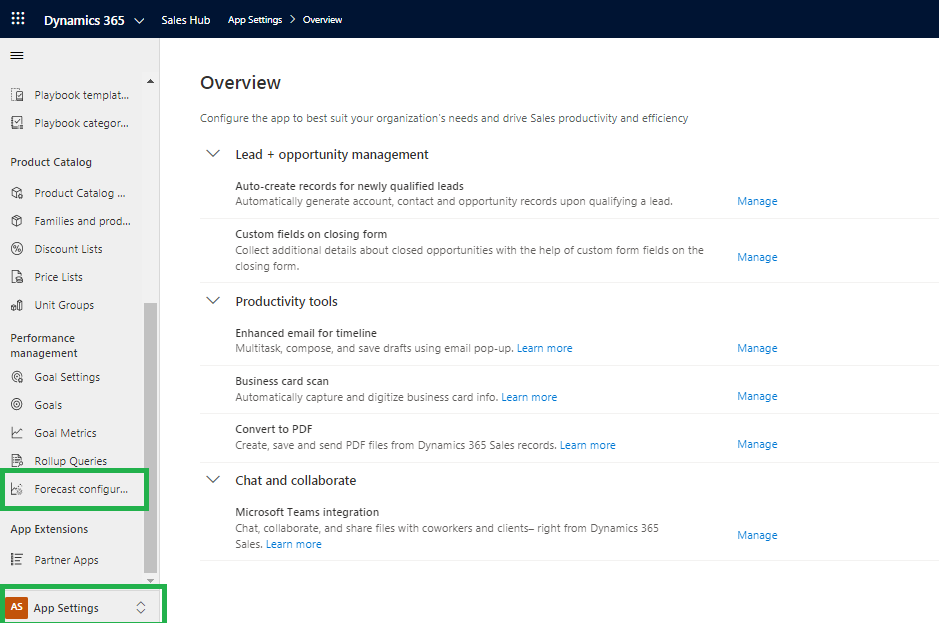
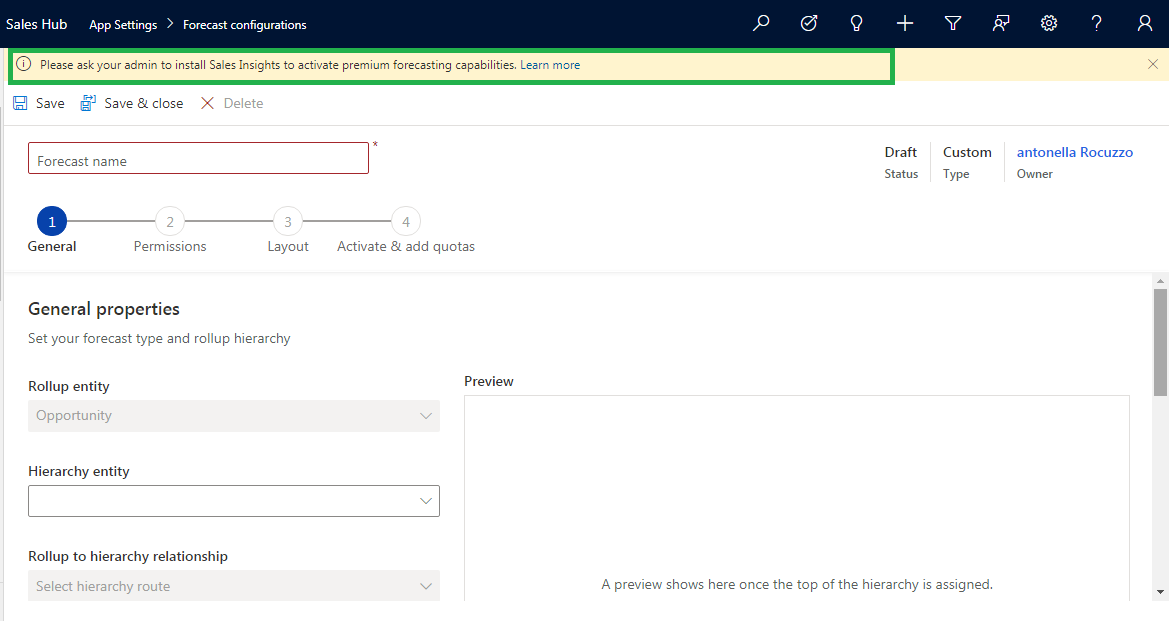
In order to create a new forecast, you need to navigate to ‘App Settings’ in the Sales Hub and select ‘Forecast Configurations’.
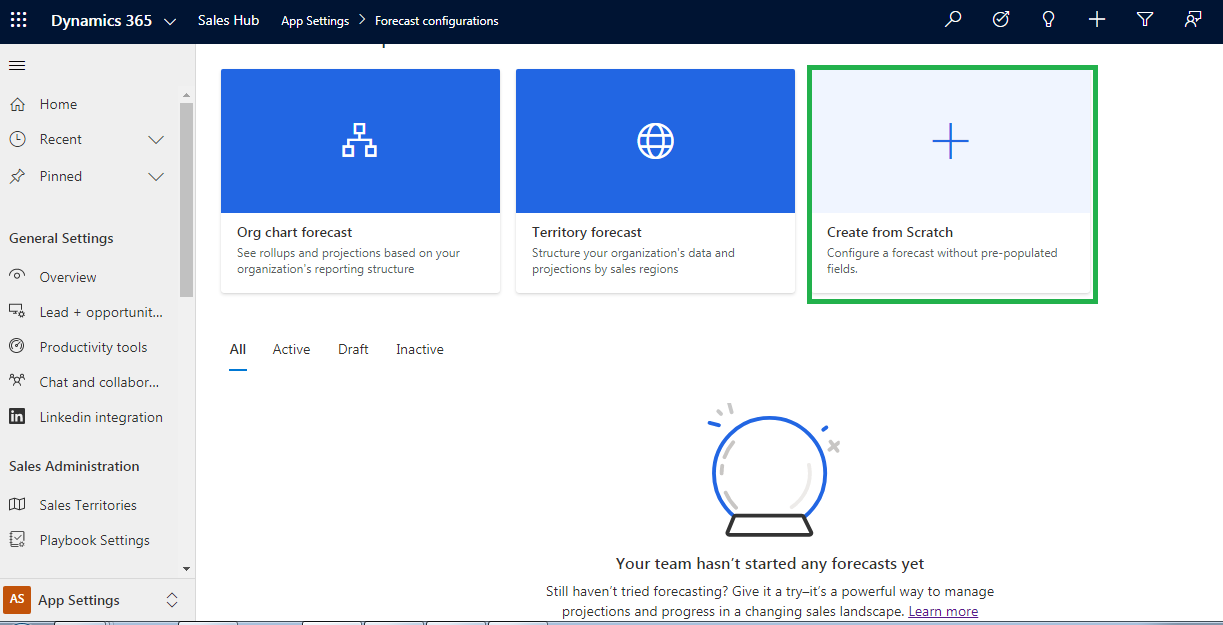
Click on the ‘Create from Scratch’ option.
Start creating the custom Forecast as per requirement by entering the below details:
Note: Similar to other forecasts this forecast option also currently only supports Opportunity entity.
In org chart, we have already seen that ‘Hierarchy entity’ field was non-editable and was default to user.
In Custom forecast, there is additional option available to choose the entities. The entities that are available for selection until date are as below:
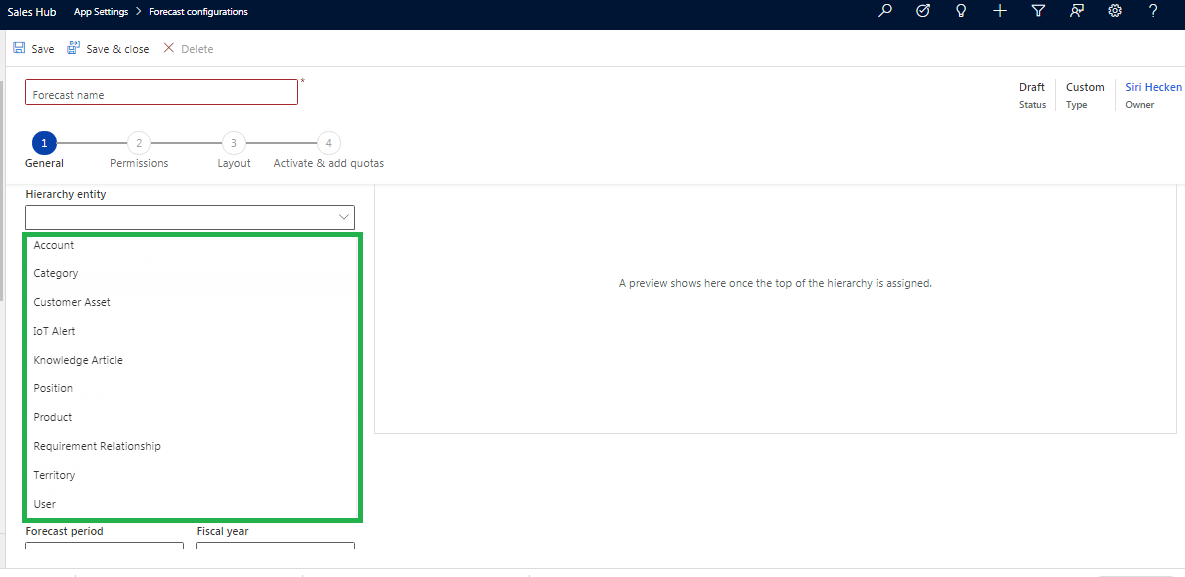
Here, Account entity is selected. From this, you can track Opportunities based on Account hierachy.
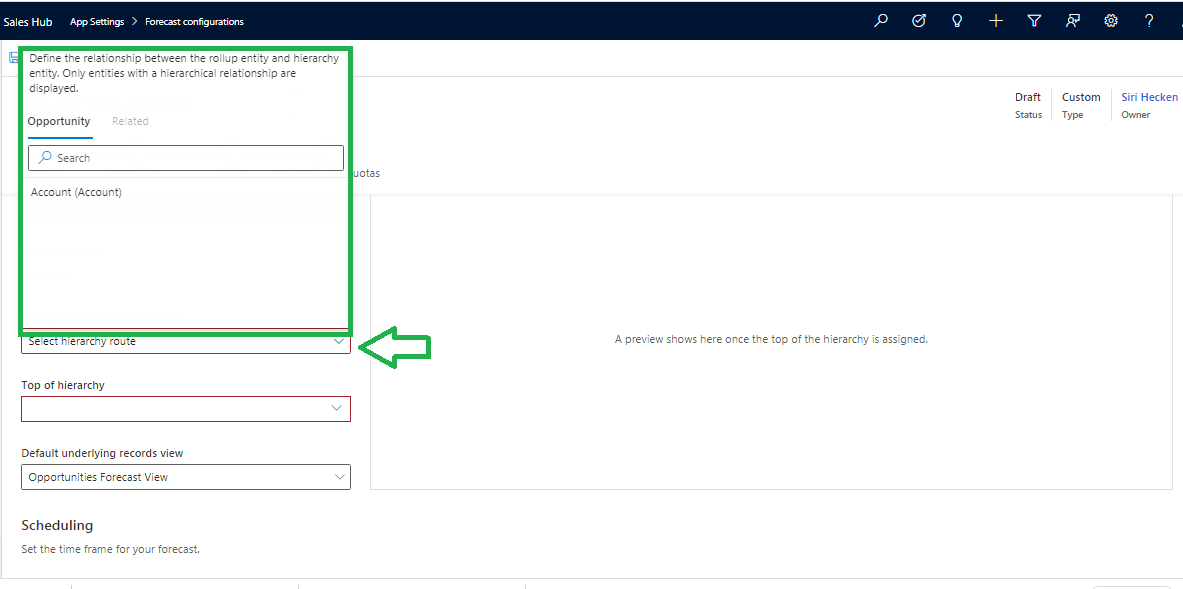
Now, you need to define hierarchy route as shown below:
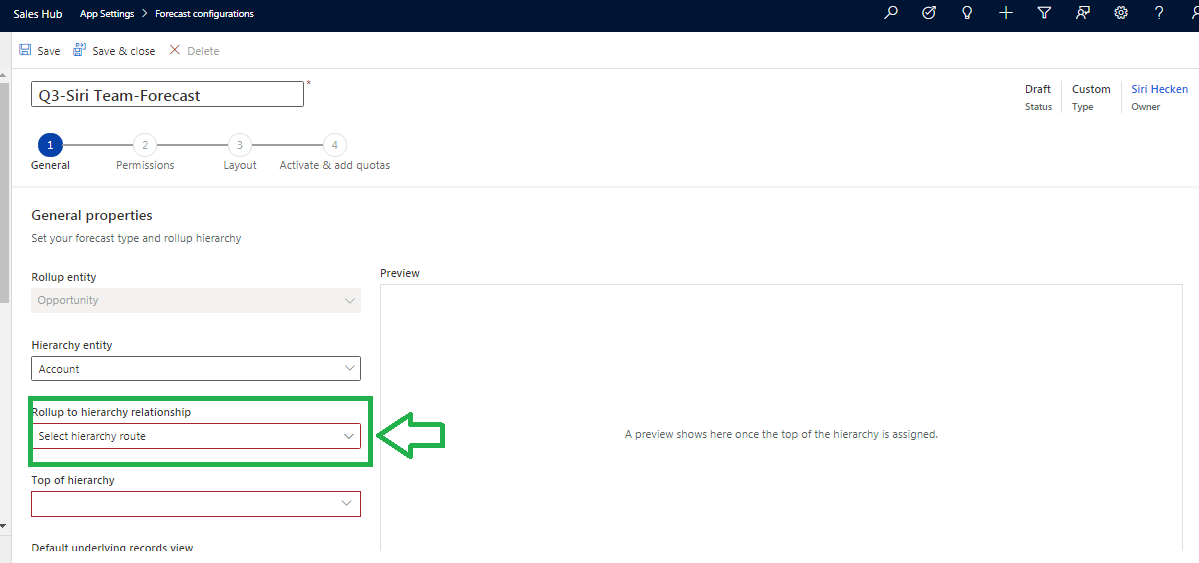
Next, select the entity as shown below:
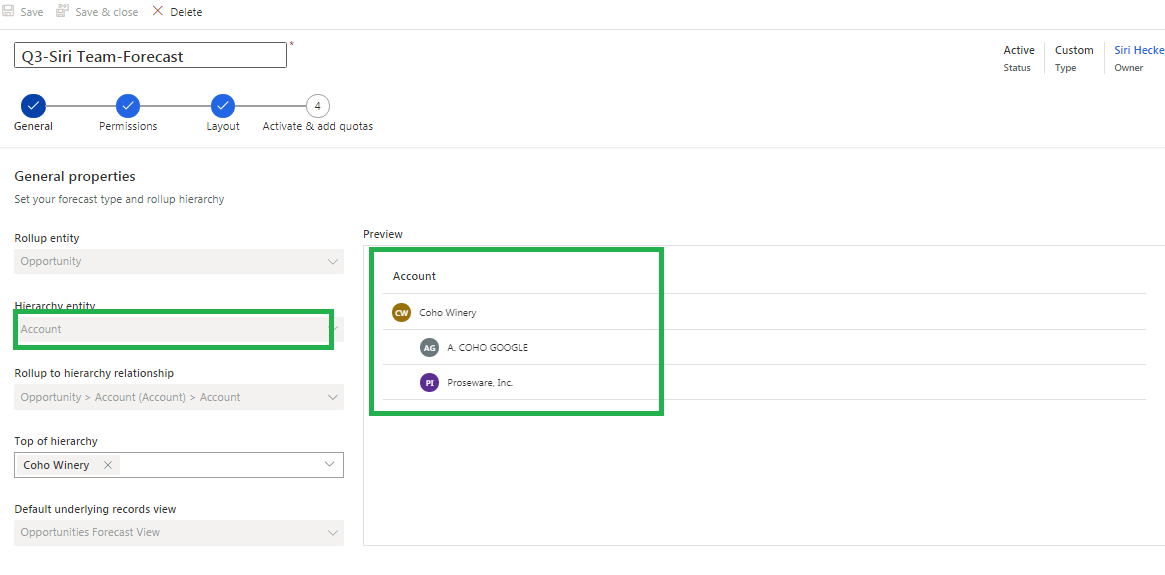
For demonstration, the Account entity that I selected is set at the top of the hierarchy using the Parent Account lookup on the Account entity. The entire hierarchy of Accounts is auto selected as shown in below screenshot:
Now complete the further steps like Permissions, Layout, Activate and add quotas same as explained in previous article.
The forecast record would be added as shown below:
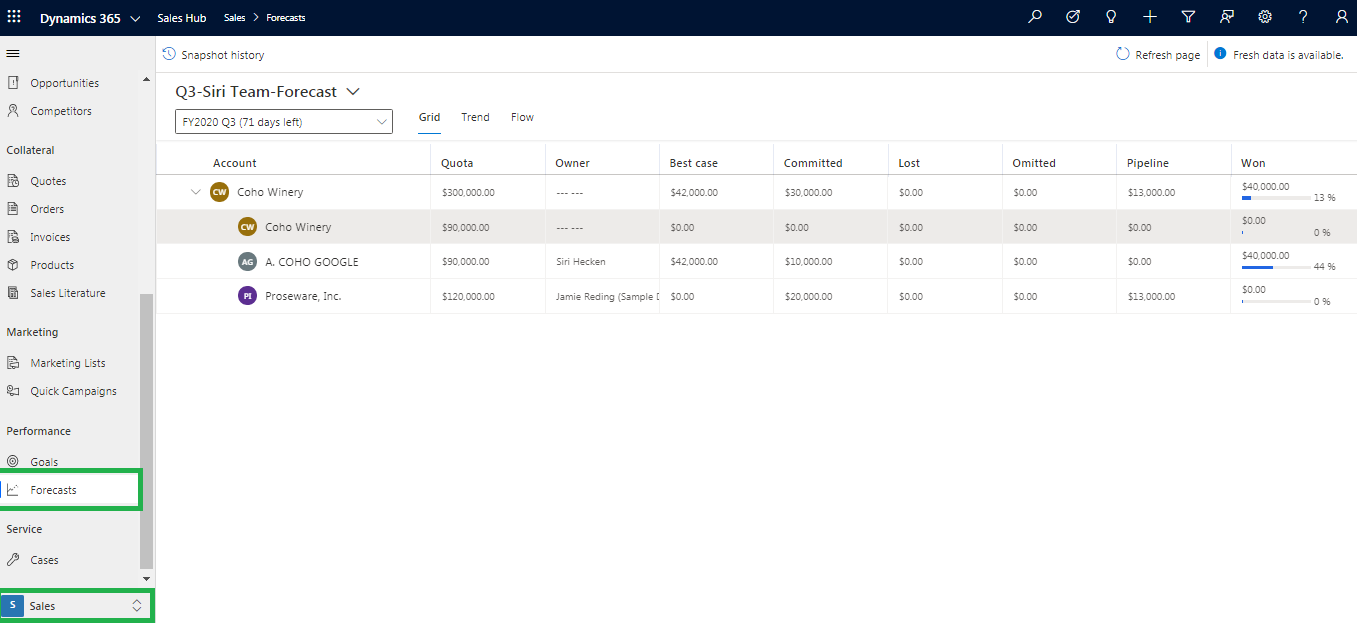
Once you have completed with this configuration, navigate to Sales –> Forecasts–> here you will see the Grid tab as shown below:
Trend and Flow visualization:
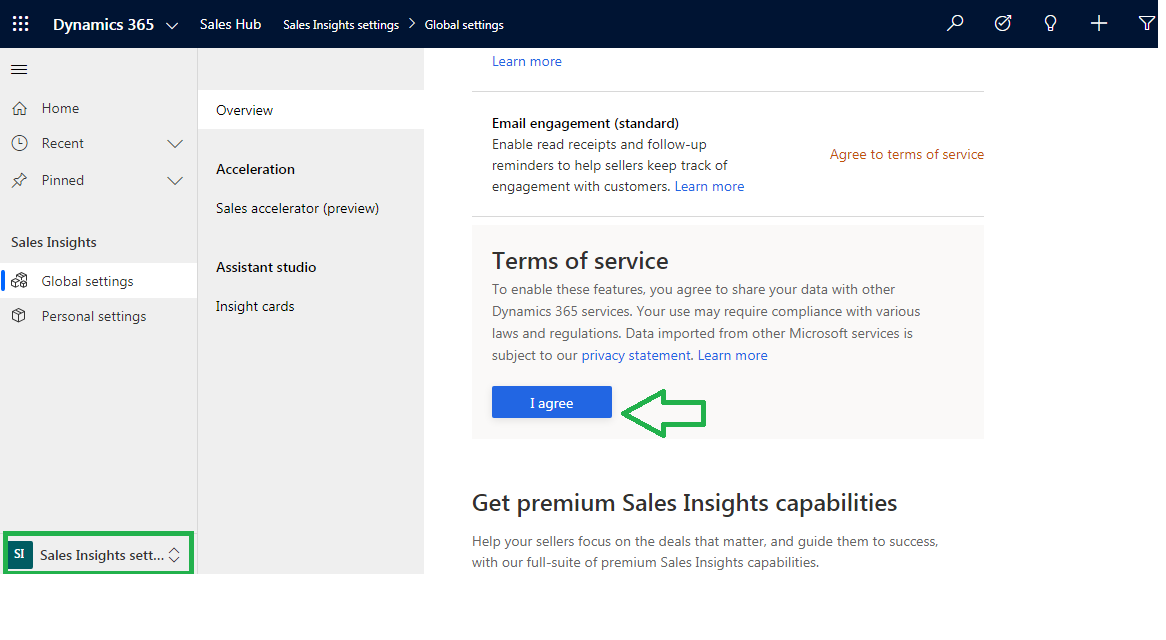
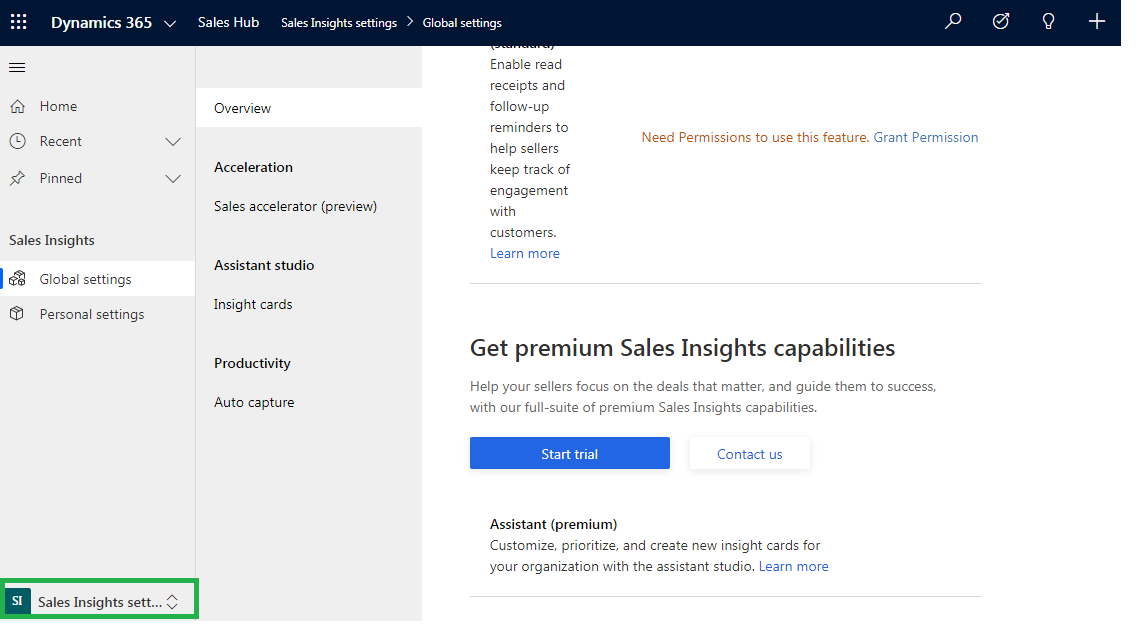
Note: You will not be able to see Trend and Flow tab enabled directly. For this, you must turn on Sales Insights capabilities as suggested below:
When you click on ‘Learn more’, you will be navigated to below page where you have to click on ‘I Agree’ button.
After that, click on ‘Start Trial’ button.
And wait for ‘Sales Insights’ configuration installation to complete. It will take few minutes to complete this installation. Once installed you will see the below screen:
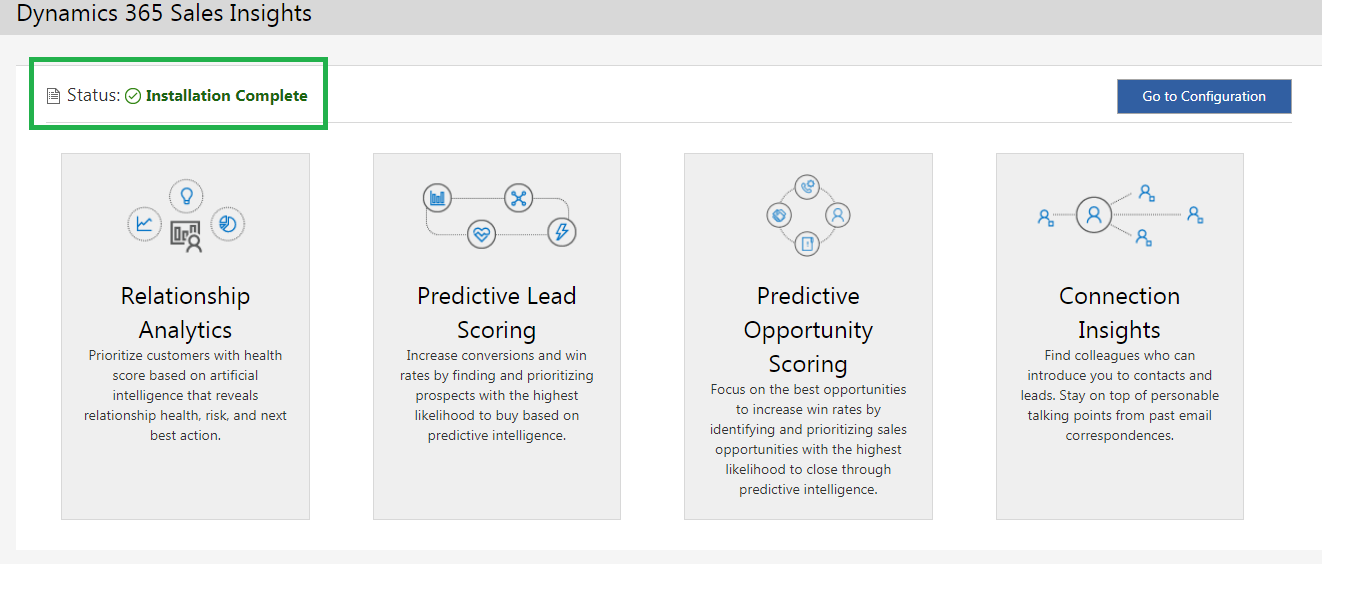
You can now see that Trend tab and Flow tab are enabled.
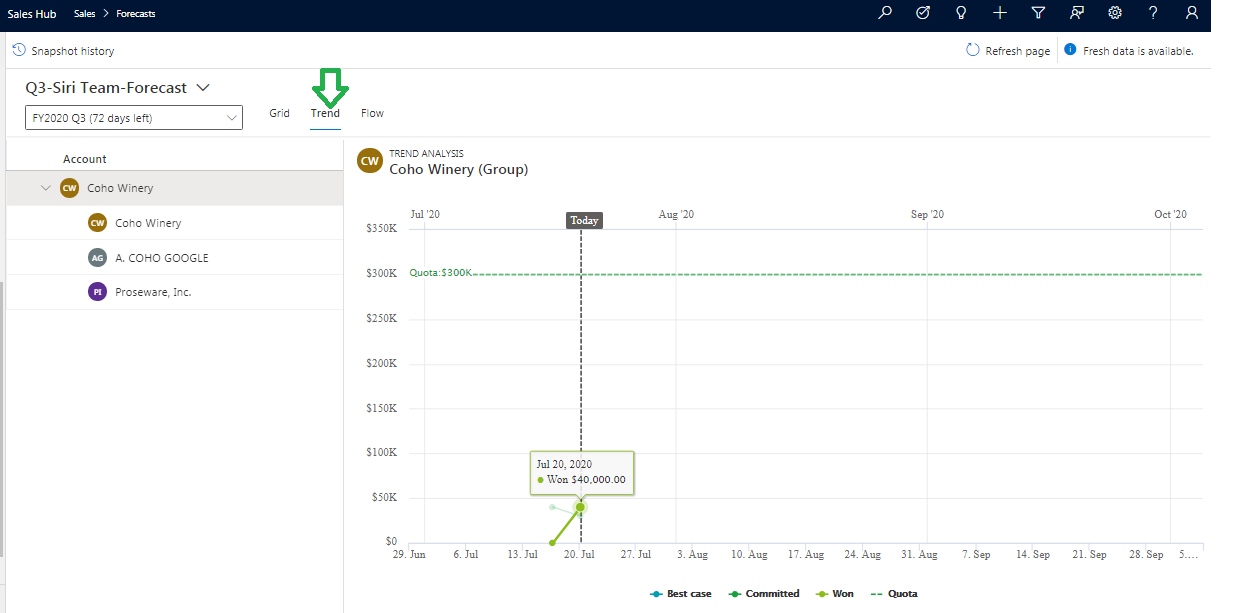
Next, navigate to Trend tab just beside the Grid tab.
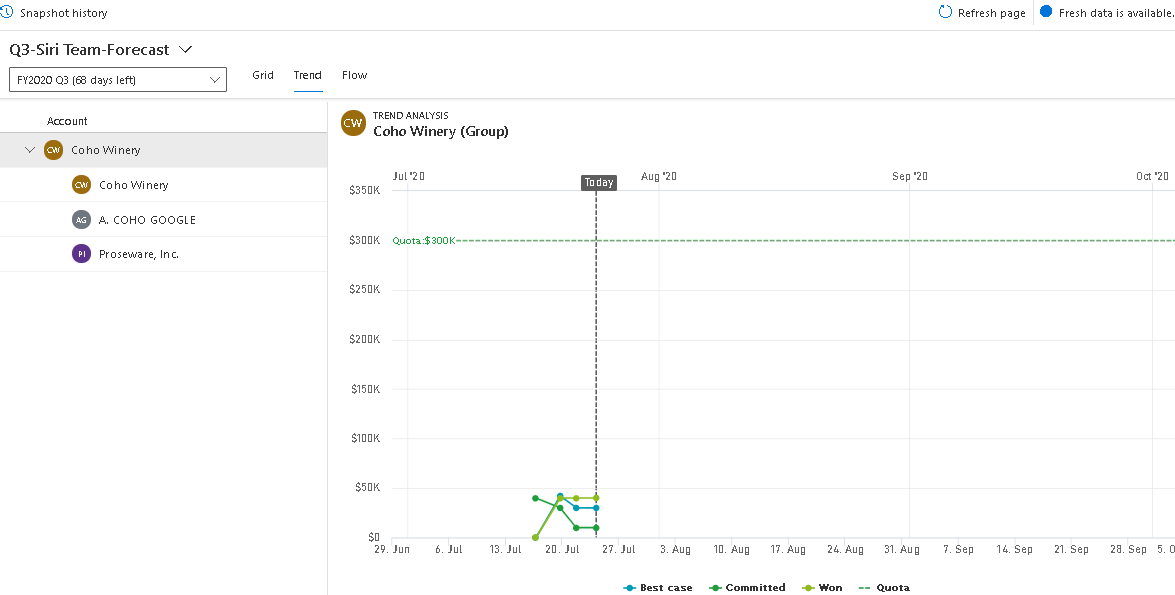
Using the trend chart, you can view the summary of a forecast category at a given time by hovering over the trend line, as shown in below screenshot. You can refer this article for more details.
Besides Trend tab there is the Flow tab which was showing the below message:
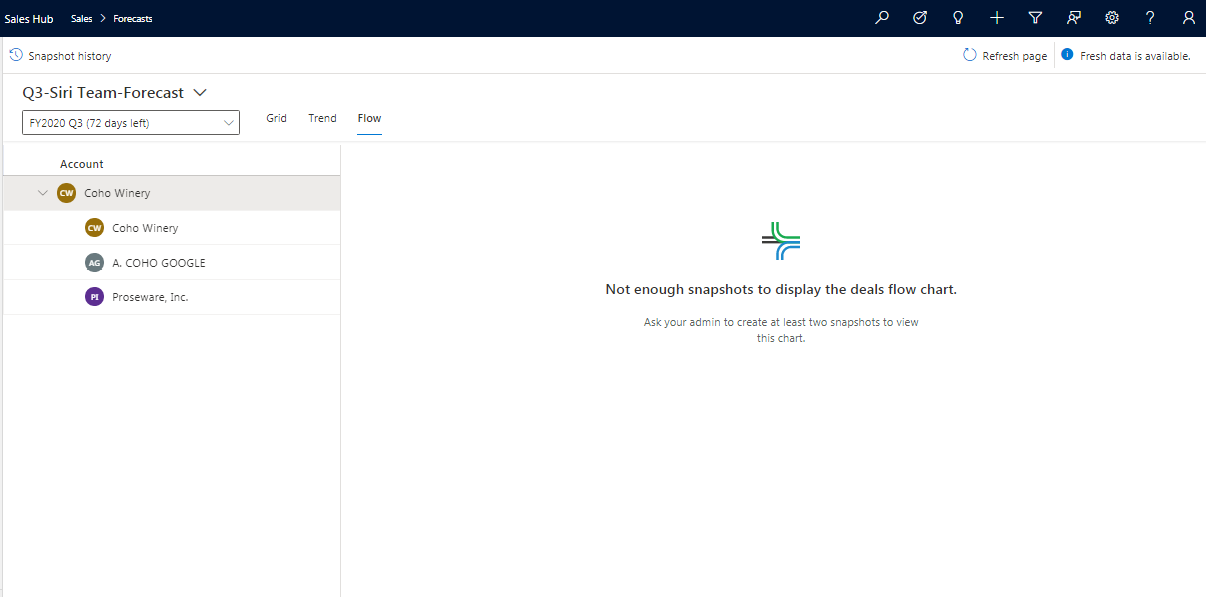
For this Flow tab to show the data, at least two snapshots should be present in the system. To know more about this, refer the given article.
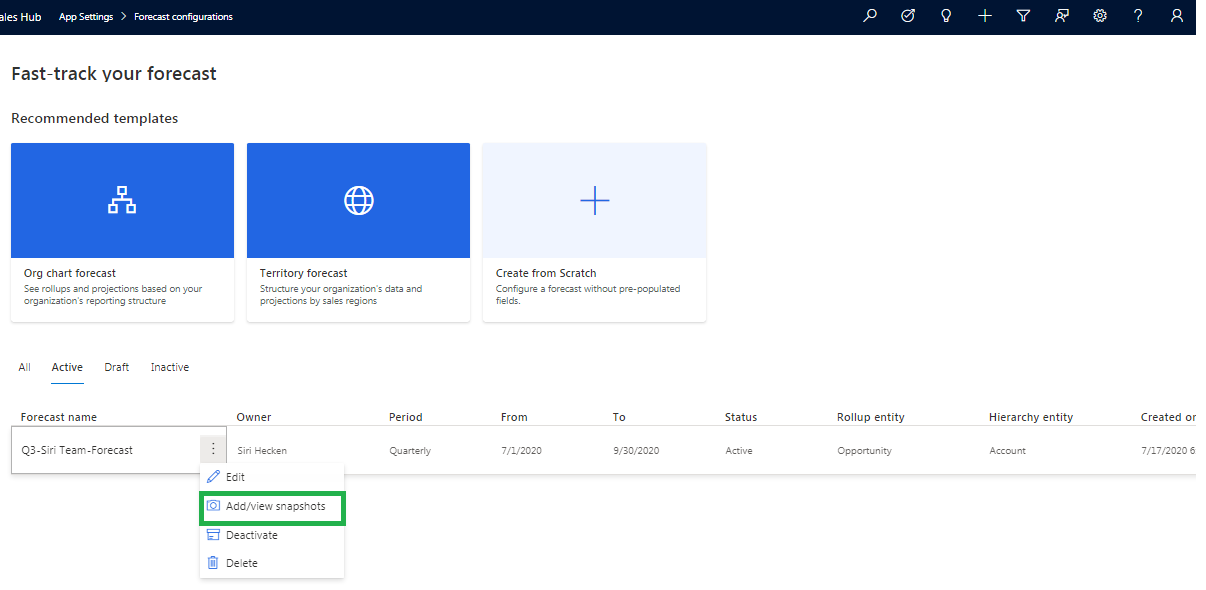
On the forecast from which you want to create a snapshot, select the ‘More options’ icon, and then select Add/view snapshots as shown below:
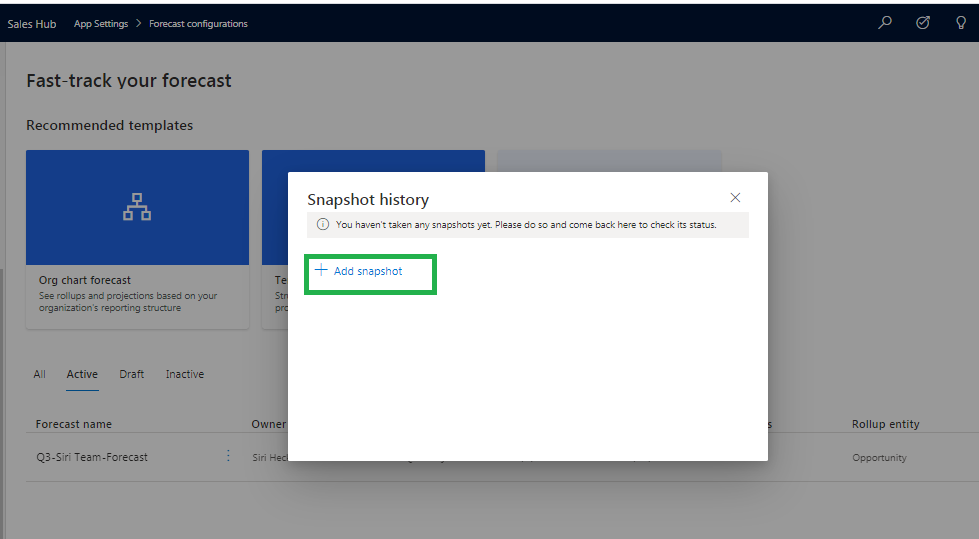
Click on Add Snapshot button.
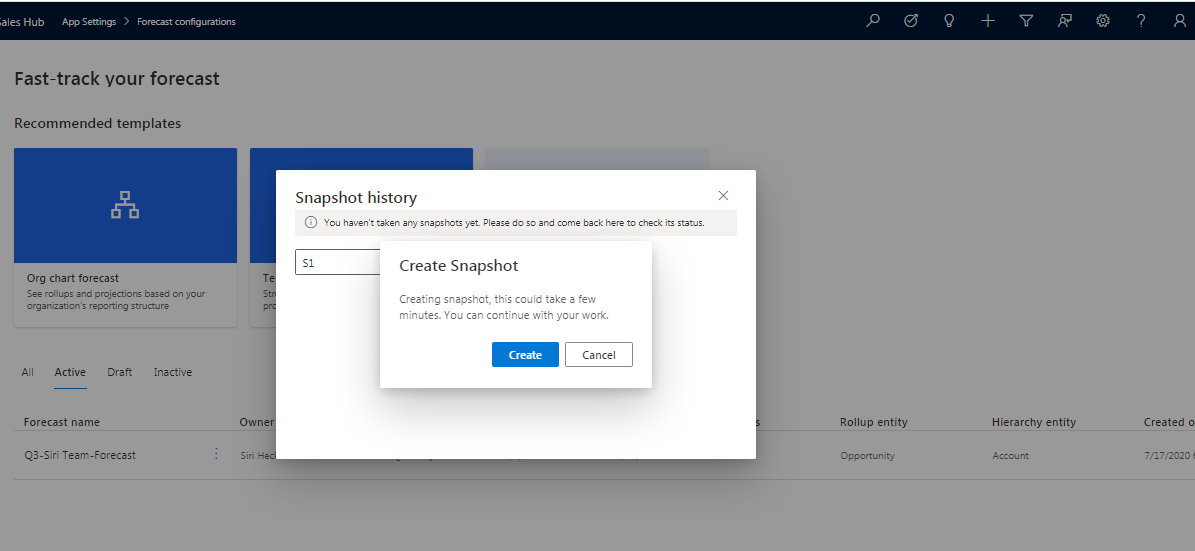
Give name to Snapshot and click on Create button.
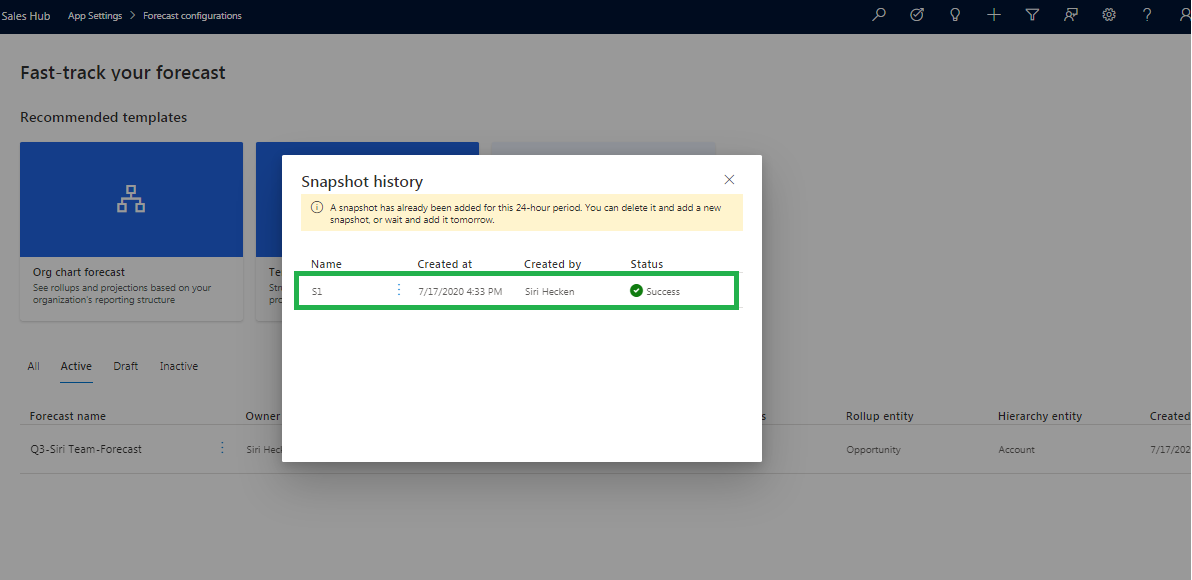
You can see the created snapshot in the Snapshot History window as shown below:
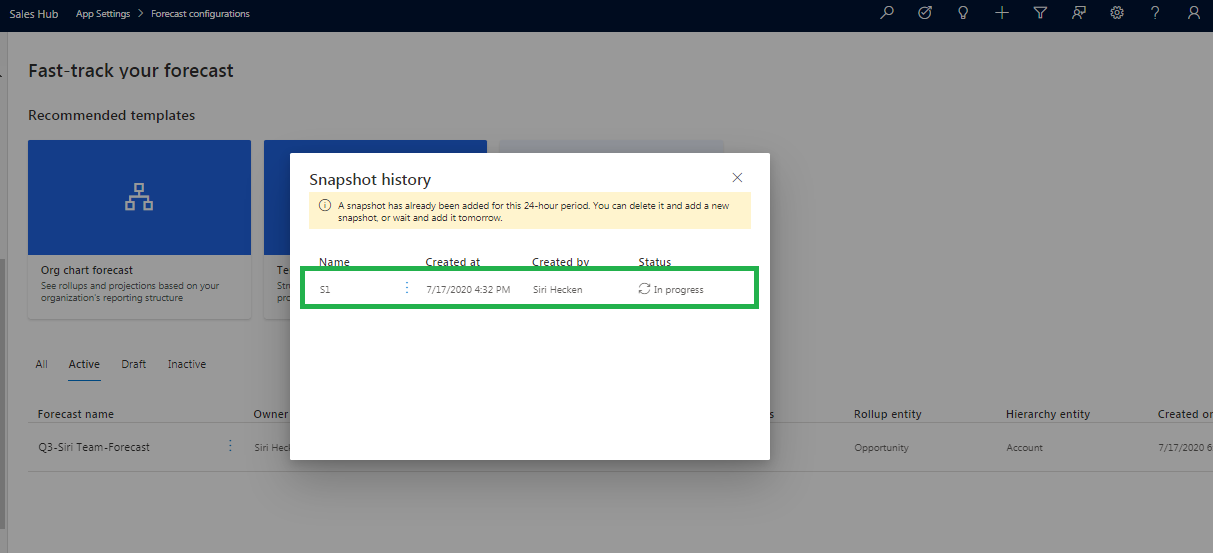
Note: After adding first snapshot, I was not able to add the second one instantly as ‘+ Add snapshot’ button disappeared. After 24-hours the ‘+ Add snapshot’ reappeared. So, if you want ‘+ Add snapshot’ button to appear immediately then you can delete the snapshot taken as shown in the above warning message and then add the snapshot.
Second snapshot created as shown below:
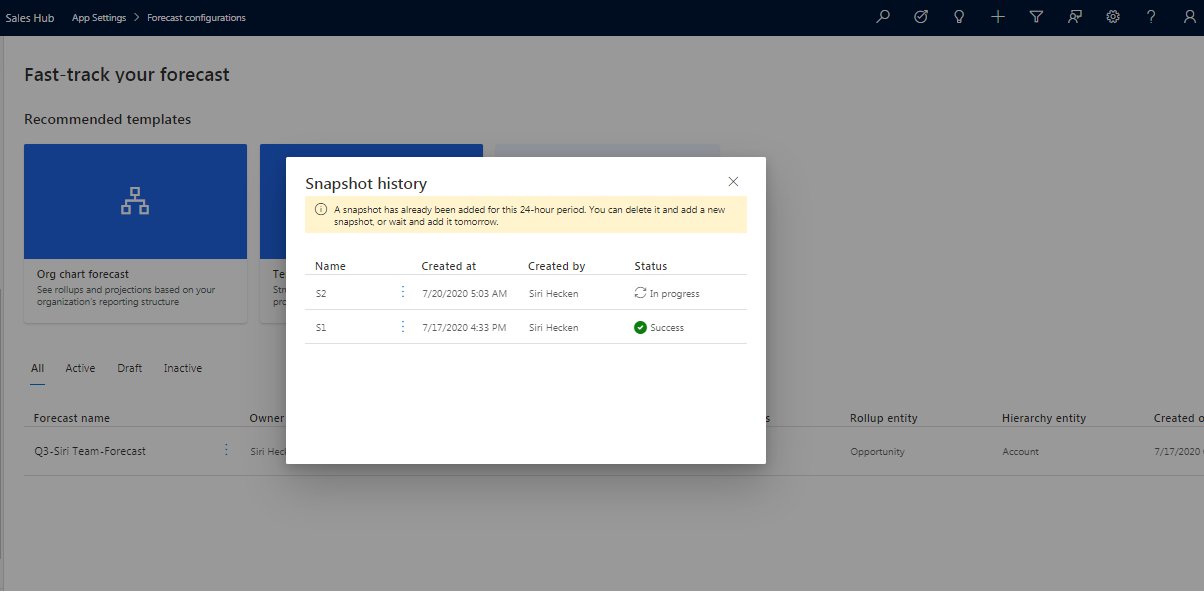
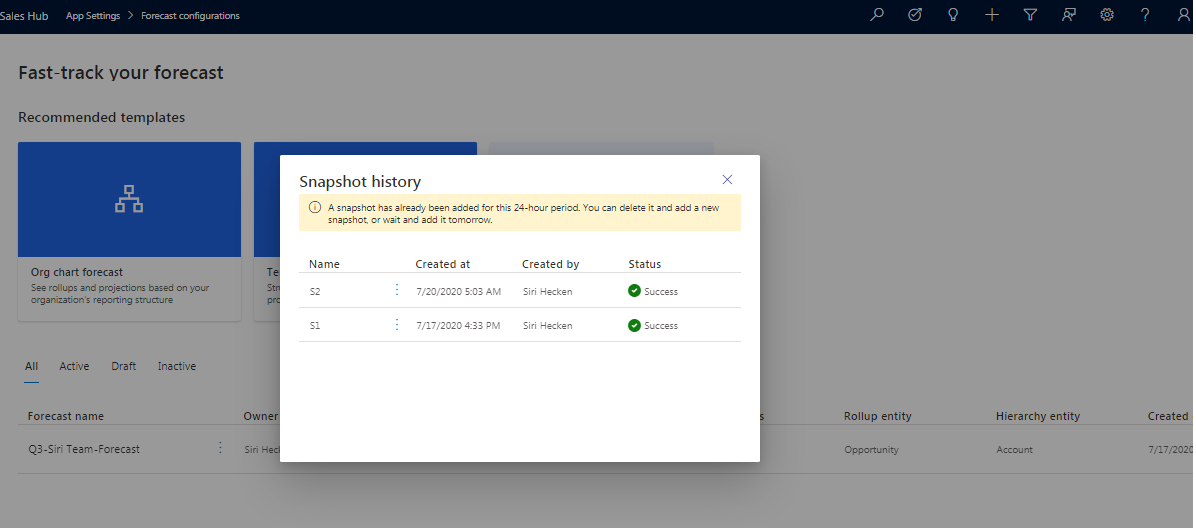
Once these two snapshots are created in the system then when we navigate to Flow tab, it will show two snapshots. Now, choose a snapshot from Snapshot 1 (named S1) and one from Snapshot 2 (named S2) and then click on Run as shown below:
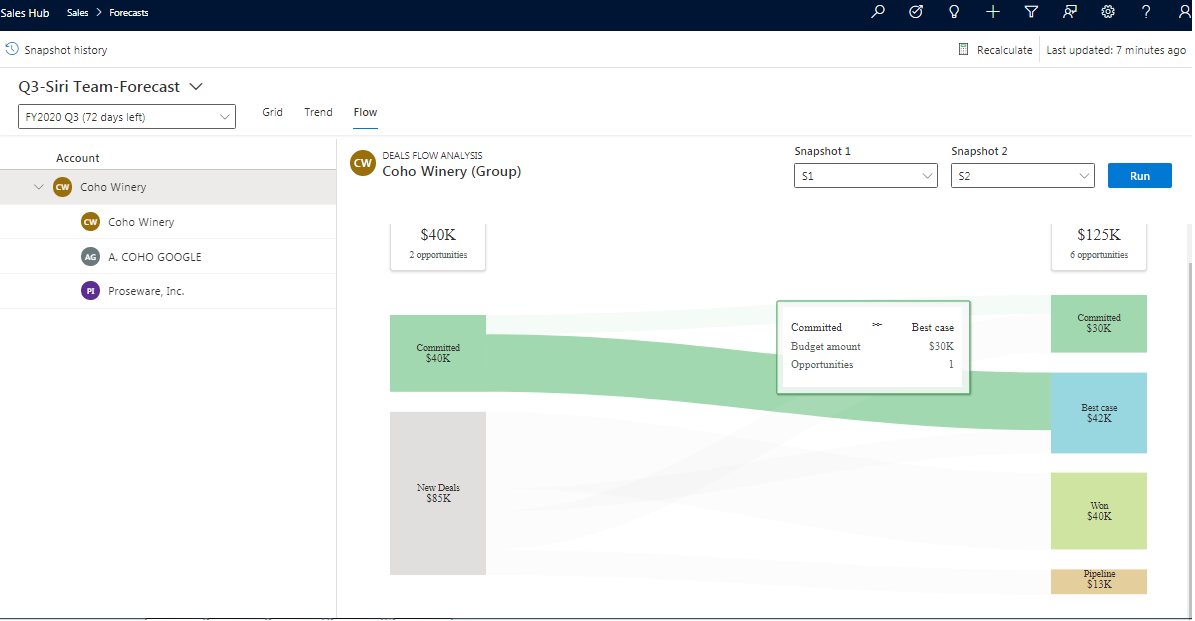
As shown in above screenshot, snapshot shows the stacks structure. You can refer the given article for more details.
Topmost stack shows summary of snapshot such as the aggregated opportunity amount and the number of opportunities that are influencing the aggregated opportunity amount.
The other columns on stack displays the forecast categories and the aggregated opportunity amount.
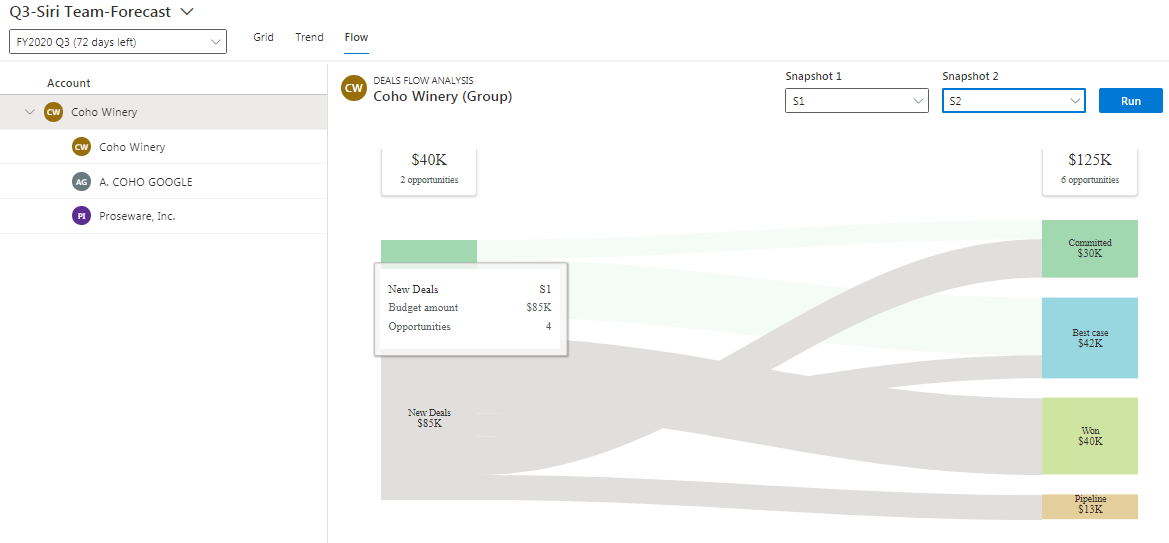
New Deals: If any underlying opportunities are added to the forecast after snapshot1 is taken then a ‘new deals’ forecast category will be added to the bottom of snapshot1 column stack with the name ‘New Deals’, as shown in below screenshot:
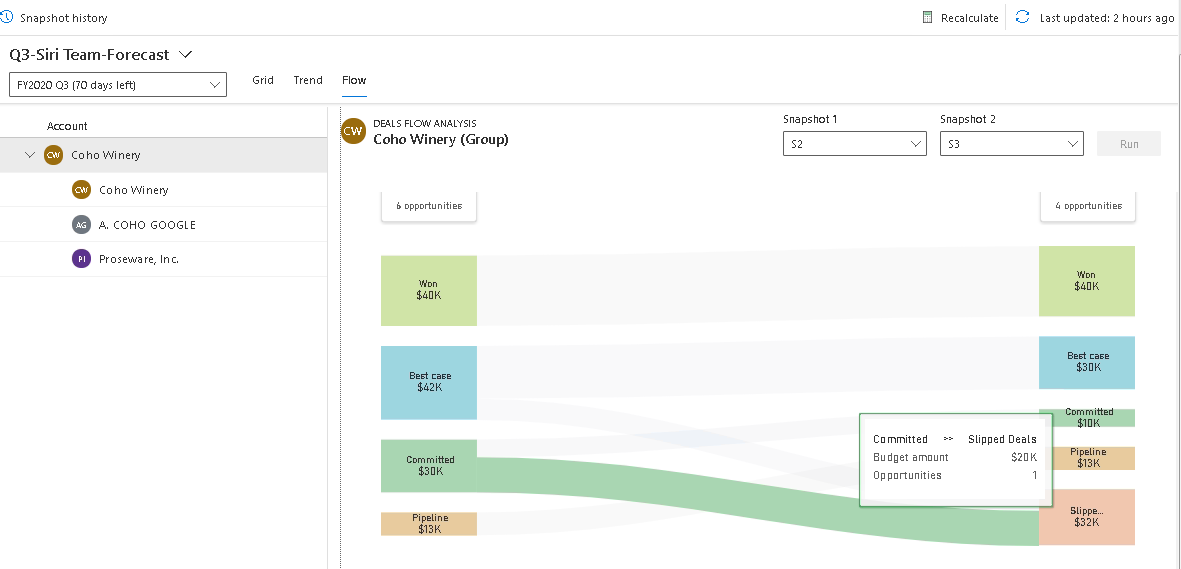
Slipped Deals: If any underlying opportunities are deleted from the forecast after snapshot2 is taken then a ‘slipped deals’ forecast category will be added to the bottom of snapshot2 column stack with the name ‘Slipped Deals’.
As shown in below screenshot, when I deleted the opportunities and then took the latest snapshot (named S3) and compared it with the previous and latest screenshot, I could see a column named ‘Slipped Deals’ was added to the stack.
Conclusion
Sales Forecasting is a great prediction tool which will be helpful for the companies to project revenue based on opportunities created by the sales team for a given period.