With every release, we brainstorm to add new features in Maplytics to enable users to increase their capabilities of geo-mapping and also incorporate the valuable feedback we receive from our customers. In our recent releases we had worked on enhancing the mapping abilities of field professionals and later we focused on empowering the managerial capabilities with our new features. In this upcoming March 2019 release, we have added an entirely new feature set to enhance the analytical aspects of mapping and worked upon the existing features to make them more productive and user friendly.
Let’s have an insight on how this release will enhance the experience of mapping visualization.
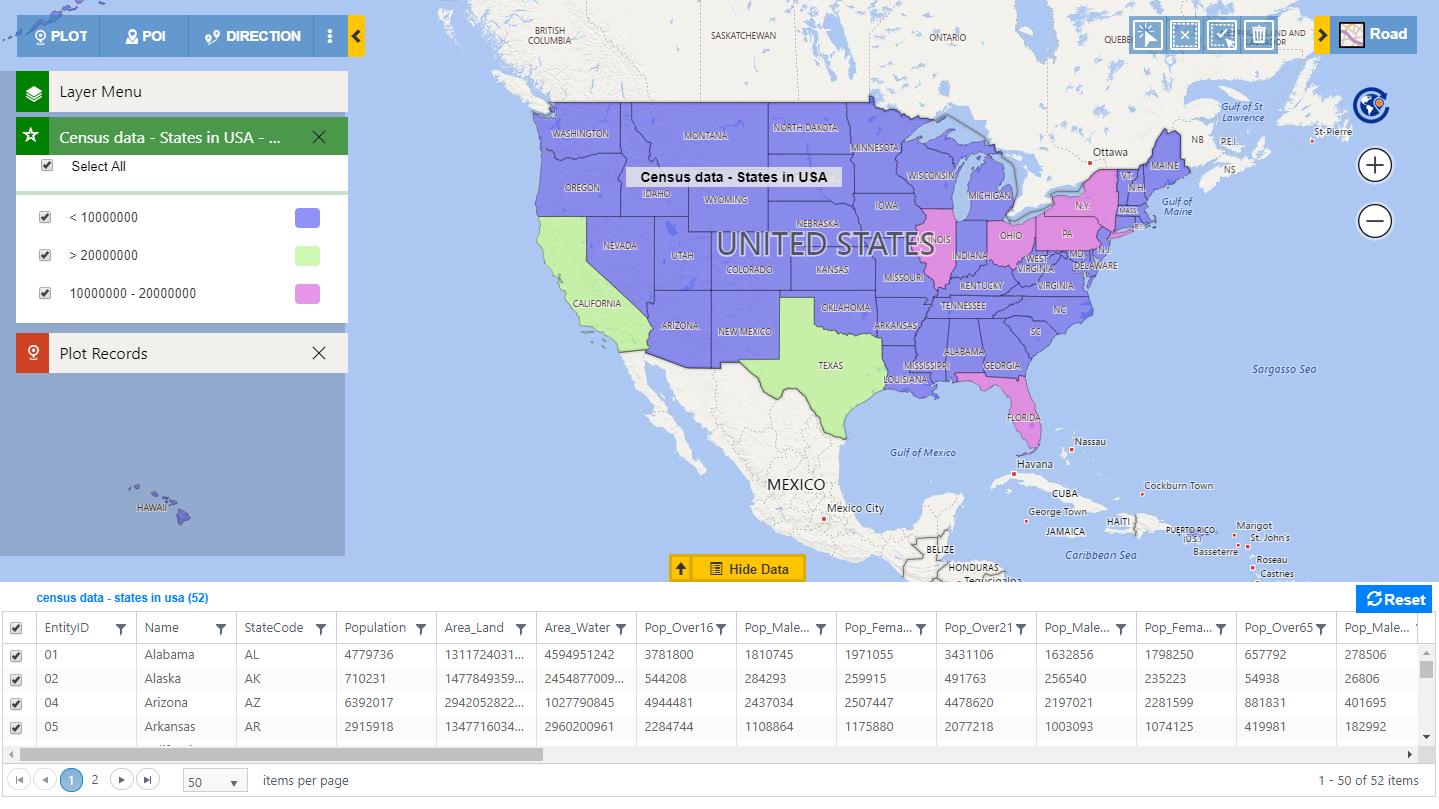
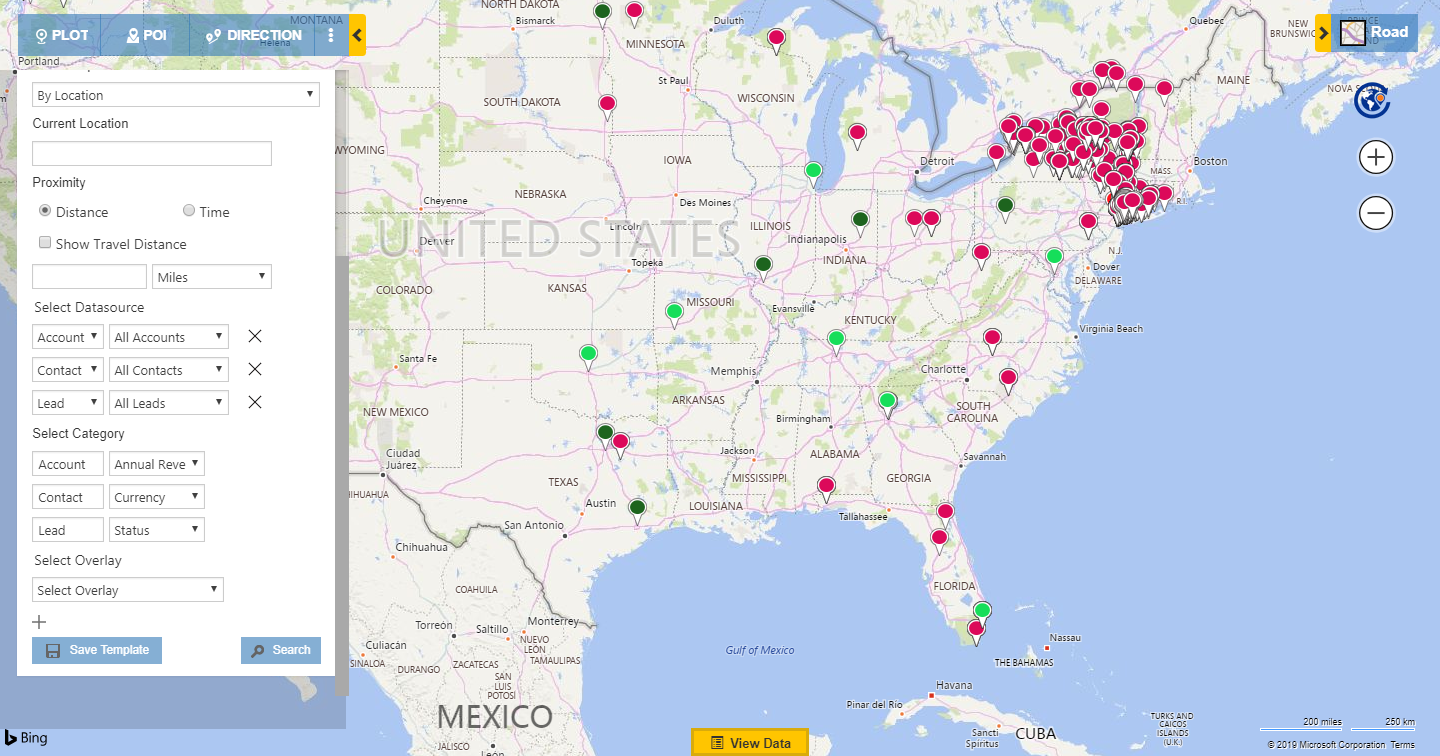
Census data visualization
To enable Maplytics to contribute more towards the analytical capability of an organization, we have added the aptitude to visualise census data on map within your Dynamics CRM. We have provided few census data for USA by default, which you can visualize on your map, and also added the option of Category Configuration for census data. You can plot the categorized census data on map for analysis and come up with effective strategic decisions. Using Maplytics you can very well save your own census data shapefile, create categories for the attributes, and plot the same on the map. The census data can be plotted with the existing Overlay feature. This feature will enable users to analyse the data of the organisation along with overlay of the territories and the census data to make the analysis even more powerful.
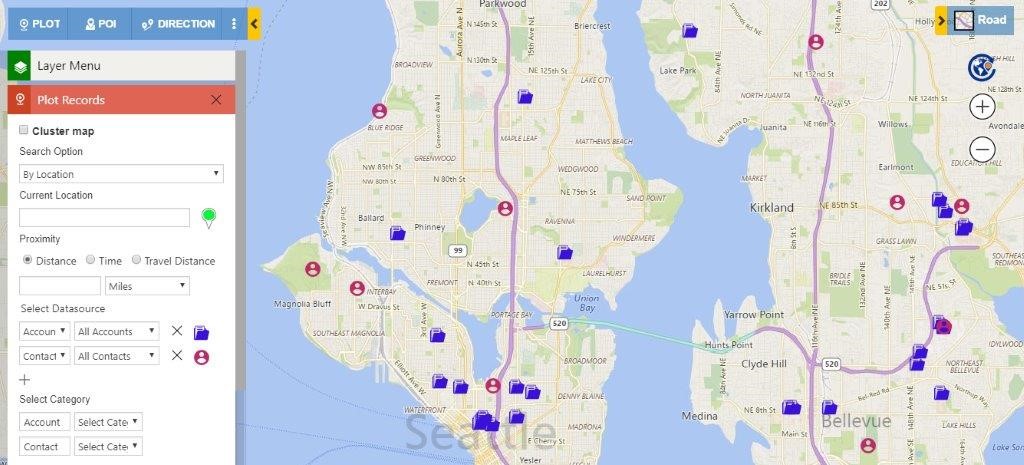
Bring your own Pushpins
Personalization is one of the most important aspects of any tool which makes it even more user friendly. Considering this, we have added the feature which enables the user to use their own icons for the push pins to visualise data on map within Dynamics CRM. We have enhanced Maplytics configuration with a completely new section where user can upload their own icons to visualise entities with their desired push pins. As we have always wanted our users to use Maplytics in their own desired ways, this feature would help them to use their own icons to recognise their entity records on map.
Resize data grid within the maps
To enhance user experience, we have added the ability to resize the view data grid which opens up on the Detail map and the Heat map. Users can now visualise their desired push pins representing the Entity records along with the respective data within the data grid into the desired ratios. User can drag the data grid to resize it as required. User can further filter the data within the view datagrid and visualise the filtered data geographically.
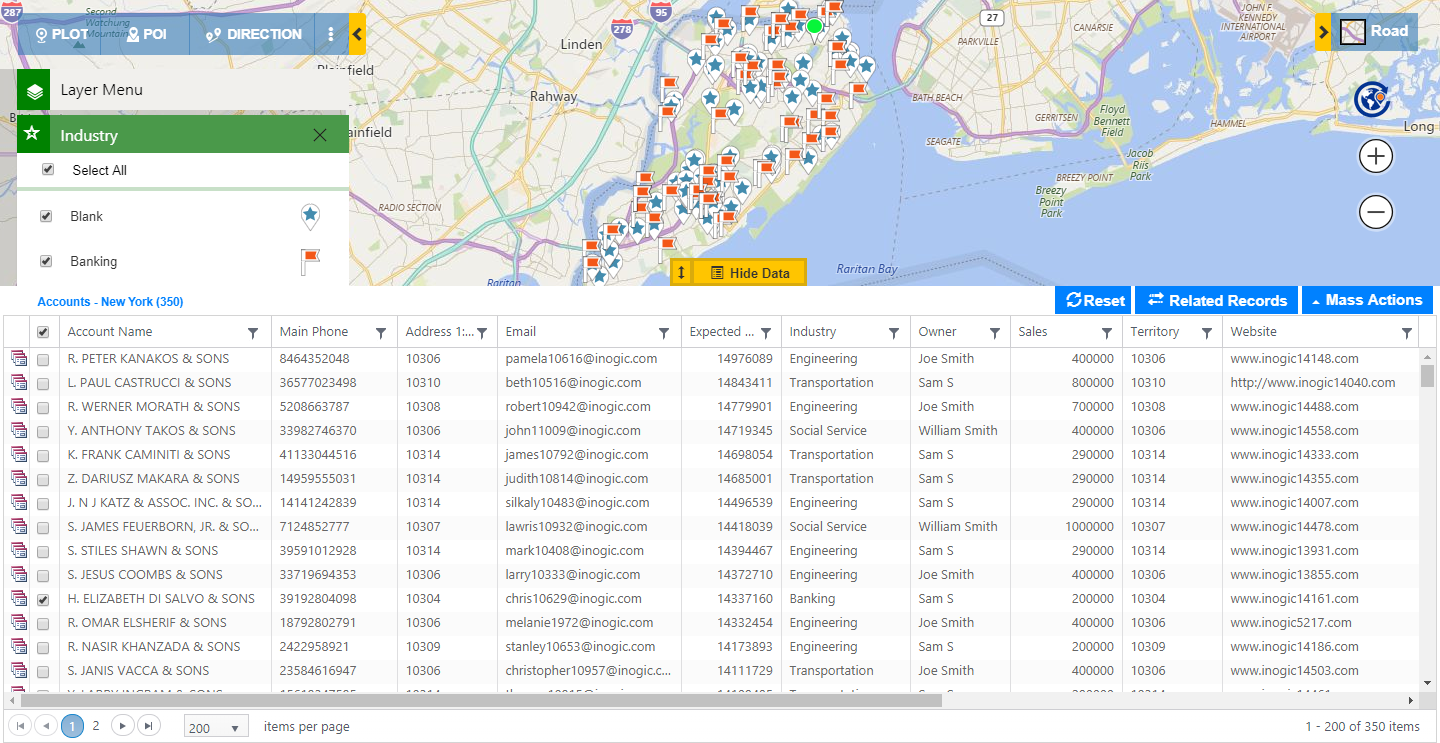
Visualize categorized data for multiple entities within Detail map
o make the geo-mapping of the entities even more productive, we have added the ability to visualize the categorized data for more than one entities. Now, user will be able to choose the categories for more than one entities (three at max) selected in the plot card of the Detail map. To summarize the categorized data, three category cards will open up where the user can further show or hide the ranges of the categories to analyze the required data.
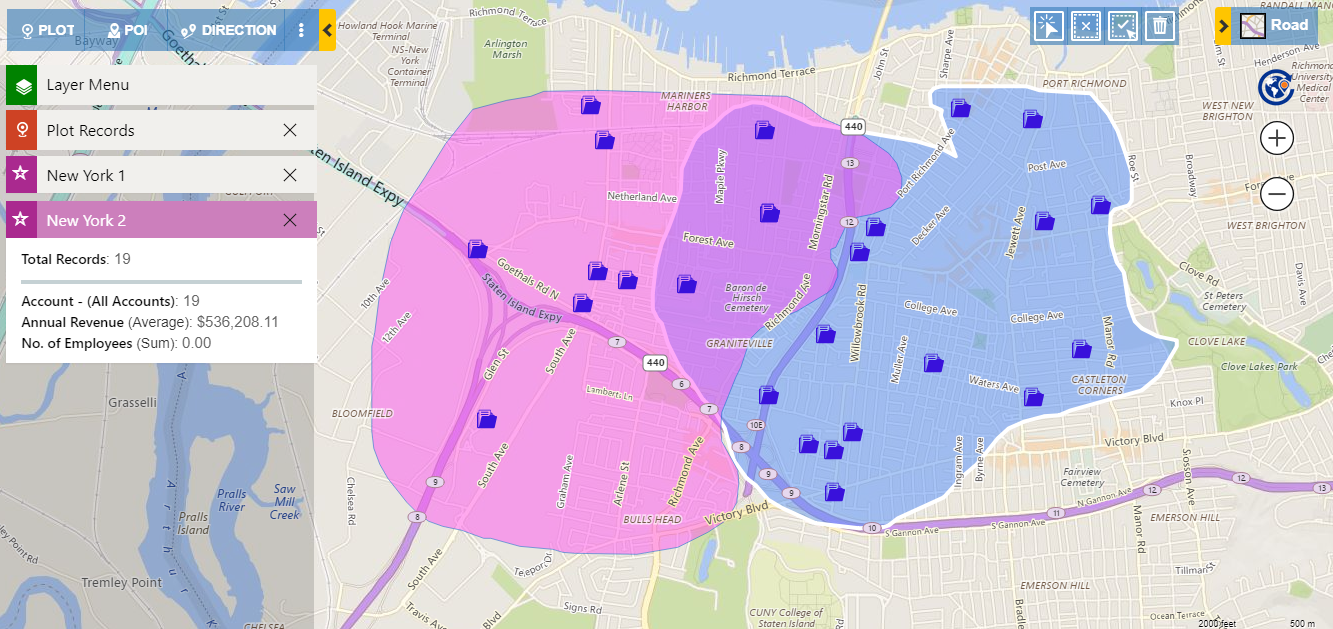
Assign multiple territories to entity records and visualize them on map
In all our recent releases we have been enhancing Territory Management to help you analyze and plan your business in a much effective way. In this release too we have worked on one of the most important requirements for sales and field service industry, which is to have multiple territories assigned to a single entity record. If the users have entity records that lie into more than one territory they can choose to enable the feature of multiple territories for the records. Users will also be able to see the list of territories assigned to an entity record and plot the territories on the map to visualize the respective records common for multiple territories.
Thus with this release we have appended new features in Maplytics that enhance the analytical and visualization capabilities of Dynamics 365 Customer Engagement users. It makes the task of mapping easier and empowers the user to perform better and detailed actions. This boosts the overall user experience and makes implementation even easier. Keep watching this space for release announcement.
Also, in case you have any suggestion, feedback or want a demo, just mail at crm@inogic.com and we will attend to you at the earliest.
Happy Mapping!