 When the lights go out, the gas stops flowing, or a water main fails, there is no grace period. Utility supply is one of the few industries where the expectation is instant response. A substation failure affecting three thousand homes, a gas leak in a commercial district, a water pressure drop across a neighbourhood are not situations where a field team can afford to spend twenty minutes figuring out who to send, what route to take, or where the nearest replacement equipment is stored.
Yet for many utility companies still operating with CRM lists and manual scheduling, that is exactly what happens. The data exists, supply centers, field engineers, maintenance schedules, asset locations, contractor networks, et al. But without geographic context, it is just a list of records that cannot tell you where anything is relative to anything else.
Maplytics, the certified geo-analytical app for Microsoft Dynamics 365, brings the spatial layer that utility operations have always needed, natively, inside the CRM, without custom development. Here is how it addresses the industry’s most pressing operational challenges.
Use Case 1: Visualizing the Supply Network and Customer Base on One Map
The Challenge: A utility provider expanding into a new region needs to understand the existing supply infrastructure, substations, distribution centers, pipeline routes, and service points, relative to the customer base it will serve. Without a geographic view, planning coverage means cross-referencing separate datasets with no spatial context.
How Maplytics Solves It: Map CRM Data plots every supply center, customer account, contractor, and service asset on an interactive Map interface inside Dynamics 365. Field managers can visualize the entire network at a glance, filterable by supply type, region, customer tier, or asset status. For new region onboarding, this geographic picture replaces weeks of manual mapping with an instant, live view drawn directly from existing CRM records. Population density, competing supplier presence, and infrastructure coverage gaps all become visible on the same map.

Use Case 2: Emergency Response, Getting the Right Team There First
The Challenge: A gas leak is reported in a commercial district. The operations center needs to identify the nearest qualified response engineer, the closest equipment depot, and the fastest route to the incident, simultaneously, under severe time pressure. In a list-based CRM, answering any one of these questions takes too long. Answering all three at once is operationally impossible.
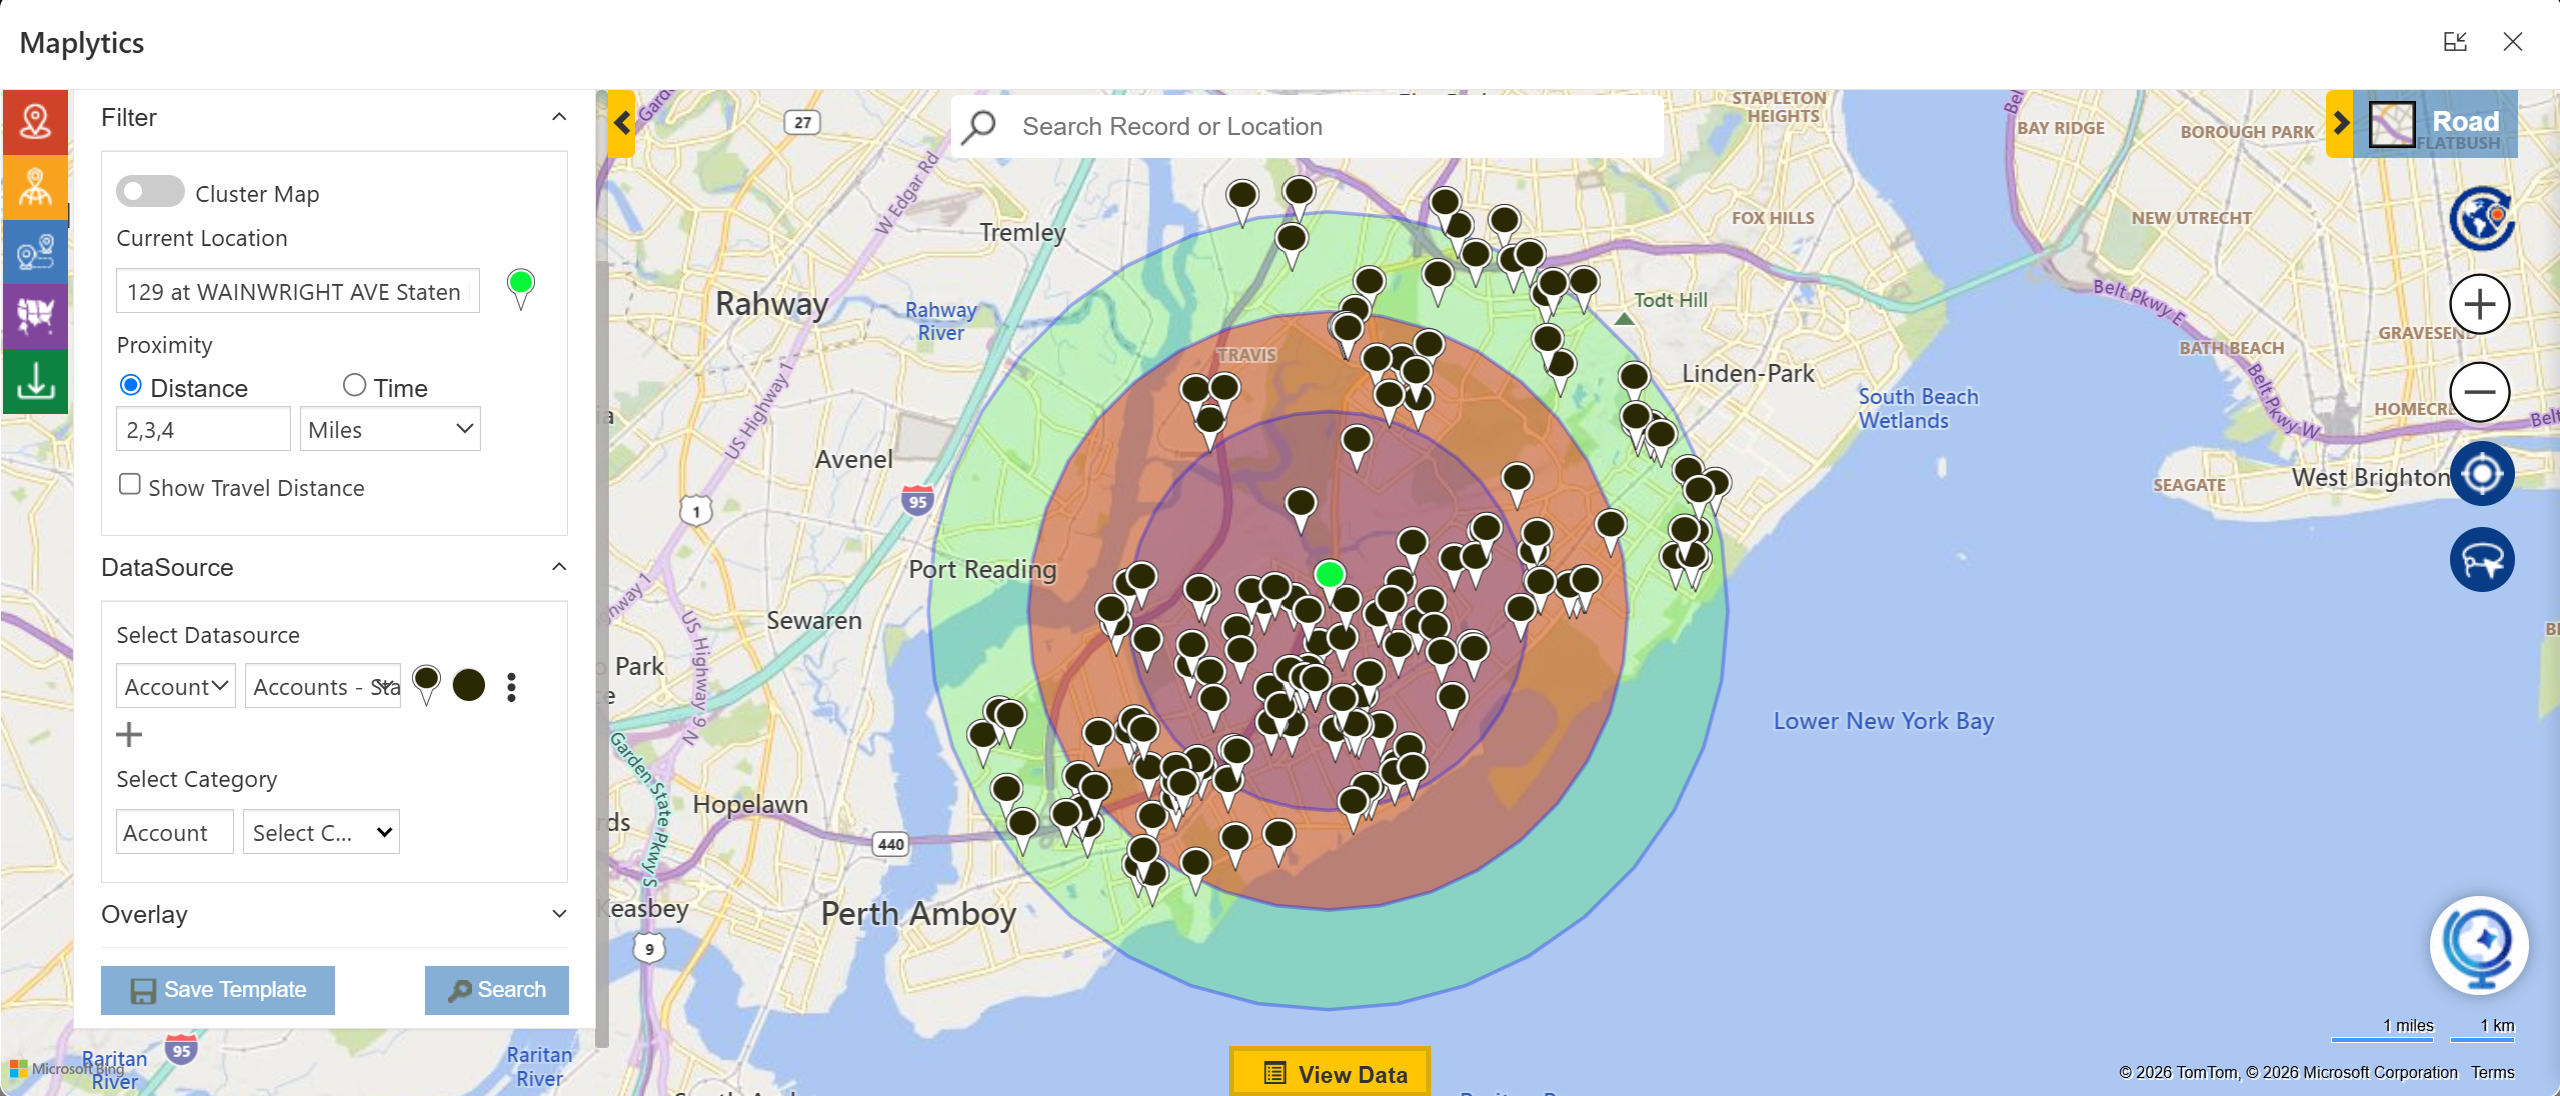
How Maplytics Solves It: Maplytics’ Proximity or Radius Search turn the incident location into an instant search origin, surfacing the nearest available field engineers, depot locations, and emergency contractors based on real driving distance, not guesswork. Real-Time Tracking shows the live location of every active field team member on the map, making it immediately clear who is closest and can respond fastest. Pre-plotted emergency routes saved inside Dynamics 365 mean that when a critical incident occurs, the path to resolution is already mapped. Response time drops. Risk exposure shrinks.
Use Case 3: Planned Maintenance Scheduling Across Wide Service Areas
The Challenge: Utility companies operate on rigorous preventive maintenance cycles, substations require regular inspection, pipelines need periodic pressure testing, and meter infrastructure demands systematic visits across large geographic areas. Building these schedules manually, while accounting for engineer availability, travel time, and geographic clustering, is enormously time-consuming, and the cost of a missed maintenance visit can be a regulatory breach or an infrastructure failure.
How Maplytics Solves It: Auto Scheduling in Maplytics generates optimized multi-day maintenance schedules for field engineers automatically, factoring in asset location, engineer availability, visit duration, travel time, and working hours. Recurring maintenance cycles can be configured once and scheduled automatically going forward, no manual rebuilding every quarter. Geofencing and Check-In/Check-Out log every site visit with a timestamp and location verification inside Dynamics 365, creating a compliance-ready audit trail that proves visits happened, when they happened, and where. For a regulated industry where proof of maintenance is as important as maintenance itself, this is not a convenience, it is a compliance requirement.

Use Case 4: Optimized Routing for Field Engineers and Supply Vehicles
The Challenge: Field engineers covering maintenance routes, supply vehicles transporting materials between depots, and repair crews moving between incident sites all share the same daily inefficiency, routes planned by habit rather than by data. For utility teams covering wide service territories, unnecessary mileage multiplies across a large fleet and accumulates into significant operational cost over a year.
How Maplytics Solves It: Route Optimization in Maplytics automatically sequences multi-stop field visits and delivery routes into the most efficient order, factoring in live traffic, road conditions, vehicle type, and departure time. Routes are saved inside Dynamics 365 and reusable for recurring service circuits, meaning a maintenance engineer covering the same twelve substations every month follows an optimized path every time, not a different one. For heavy supply vehicles, route planning can account for road suitability and weight restrictions, ensuring assets reach their destination safely and on schedule.

Use Case 5: Territory Management for Contractor and Service Area Assignment
The Challenge: Utility companies typically operate through a combination of in-house field teams and contracted service providers, each covering defined service areas. Without clear geographic boundaries, coverage overlaps and gaps develop quietly, two contractors responding to the same incident while a failure three kilometers away goes unattended because nobody’s territory clearly covers it.
How Maplytics Solves It: Territory Management in Maplytics allows operations managers to draw, assign, and balance service territories directly on the map inside Dynamics 365, by postcode, region, infrastructure zone, or custom boundary. Each contractor or field team sees only their assigned territory. Managers see the complete coverage picture. The Draft Territory feature lets managers model realignments before committing them to live assignments, critical in utility operations where territory changes carry contractual and regulatory implications. Coverage gaps become visible before a failure makes them apparent.
Use Case 6: Heat Map Analysis for Infrastructure Expansion and Demand Planning
The Challenge: A water utility planning infrastructure expansion needs to understand where population density is growing fastest relative to current supply capacity. An electricity provider assessing grid investment needs to identify where demand concentration is highest but infrastructure coverage is thinnest. These decisions carry capital commitments of millions, and without geographic data visualisation, they rest on assumptions rather than evidence.
How Maplytics Solves It: Heat Map Visualization in Maplytics overlays customer density, service request frequency, or incident concentration across any region directly inside Dynamics 365. High-demand areas with insufficient current infrastructure become visually obvious, pointing investment decisions toward where they will deliver the greatest operational and commercial return. For utility providers operating under regulatory mandates to achieve service coverage targets, this geographic picture transforms infrastructure planning from an intuition-led exercise into a data-driven one.
The Bottom Line
Utility supply is an industry where operational failures have consequences that go well beyond lost revenue. A delayed emergency response, a missed maintenance visit, or a territorial coverage gap can mean regulatory penalties, infrastructure damage, and real harm to the communities a utility provider serves.
What’s More?
If you wish to combine maps, routes, schedules, and real-time updates to make a difference, Maplytics with MapCopilot, its AI assistant, is available immediately for Dynamics 365, Power Apps, Power Pages, and Dataverse. Organizations interested in adoption, 15-day free trials, or personalized demos are encouraged to contact Maplytics’ sales team at crm@inogic.com
For more information, visit our website or Microsoft Marketplace. One can hop onto the detailed Blogs, Client Testimonials, Success Stories, Industry Applications, and Video Library for a quick query resolution. Technical docs for the working of Maplytics are also available for reference.
Please leave us a review or share your experience on the Microsoft Marketplace or the G2 Website.