 Is your Dynamics 365 CRM helping you make decisions, or just storing data?
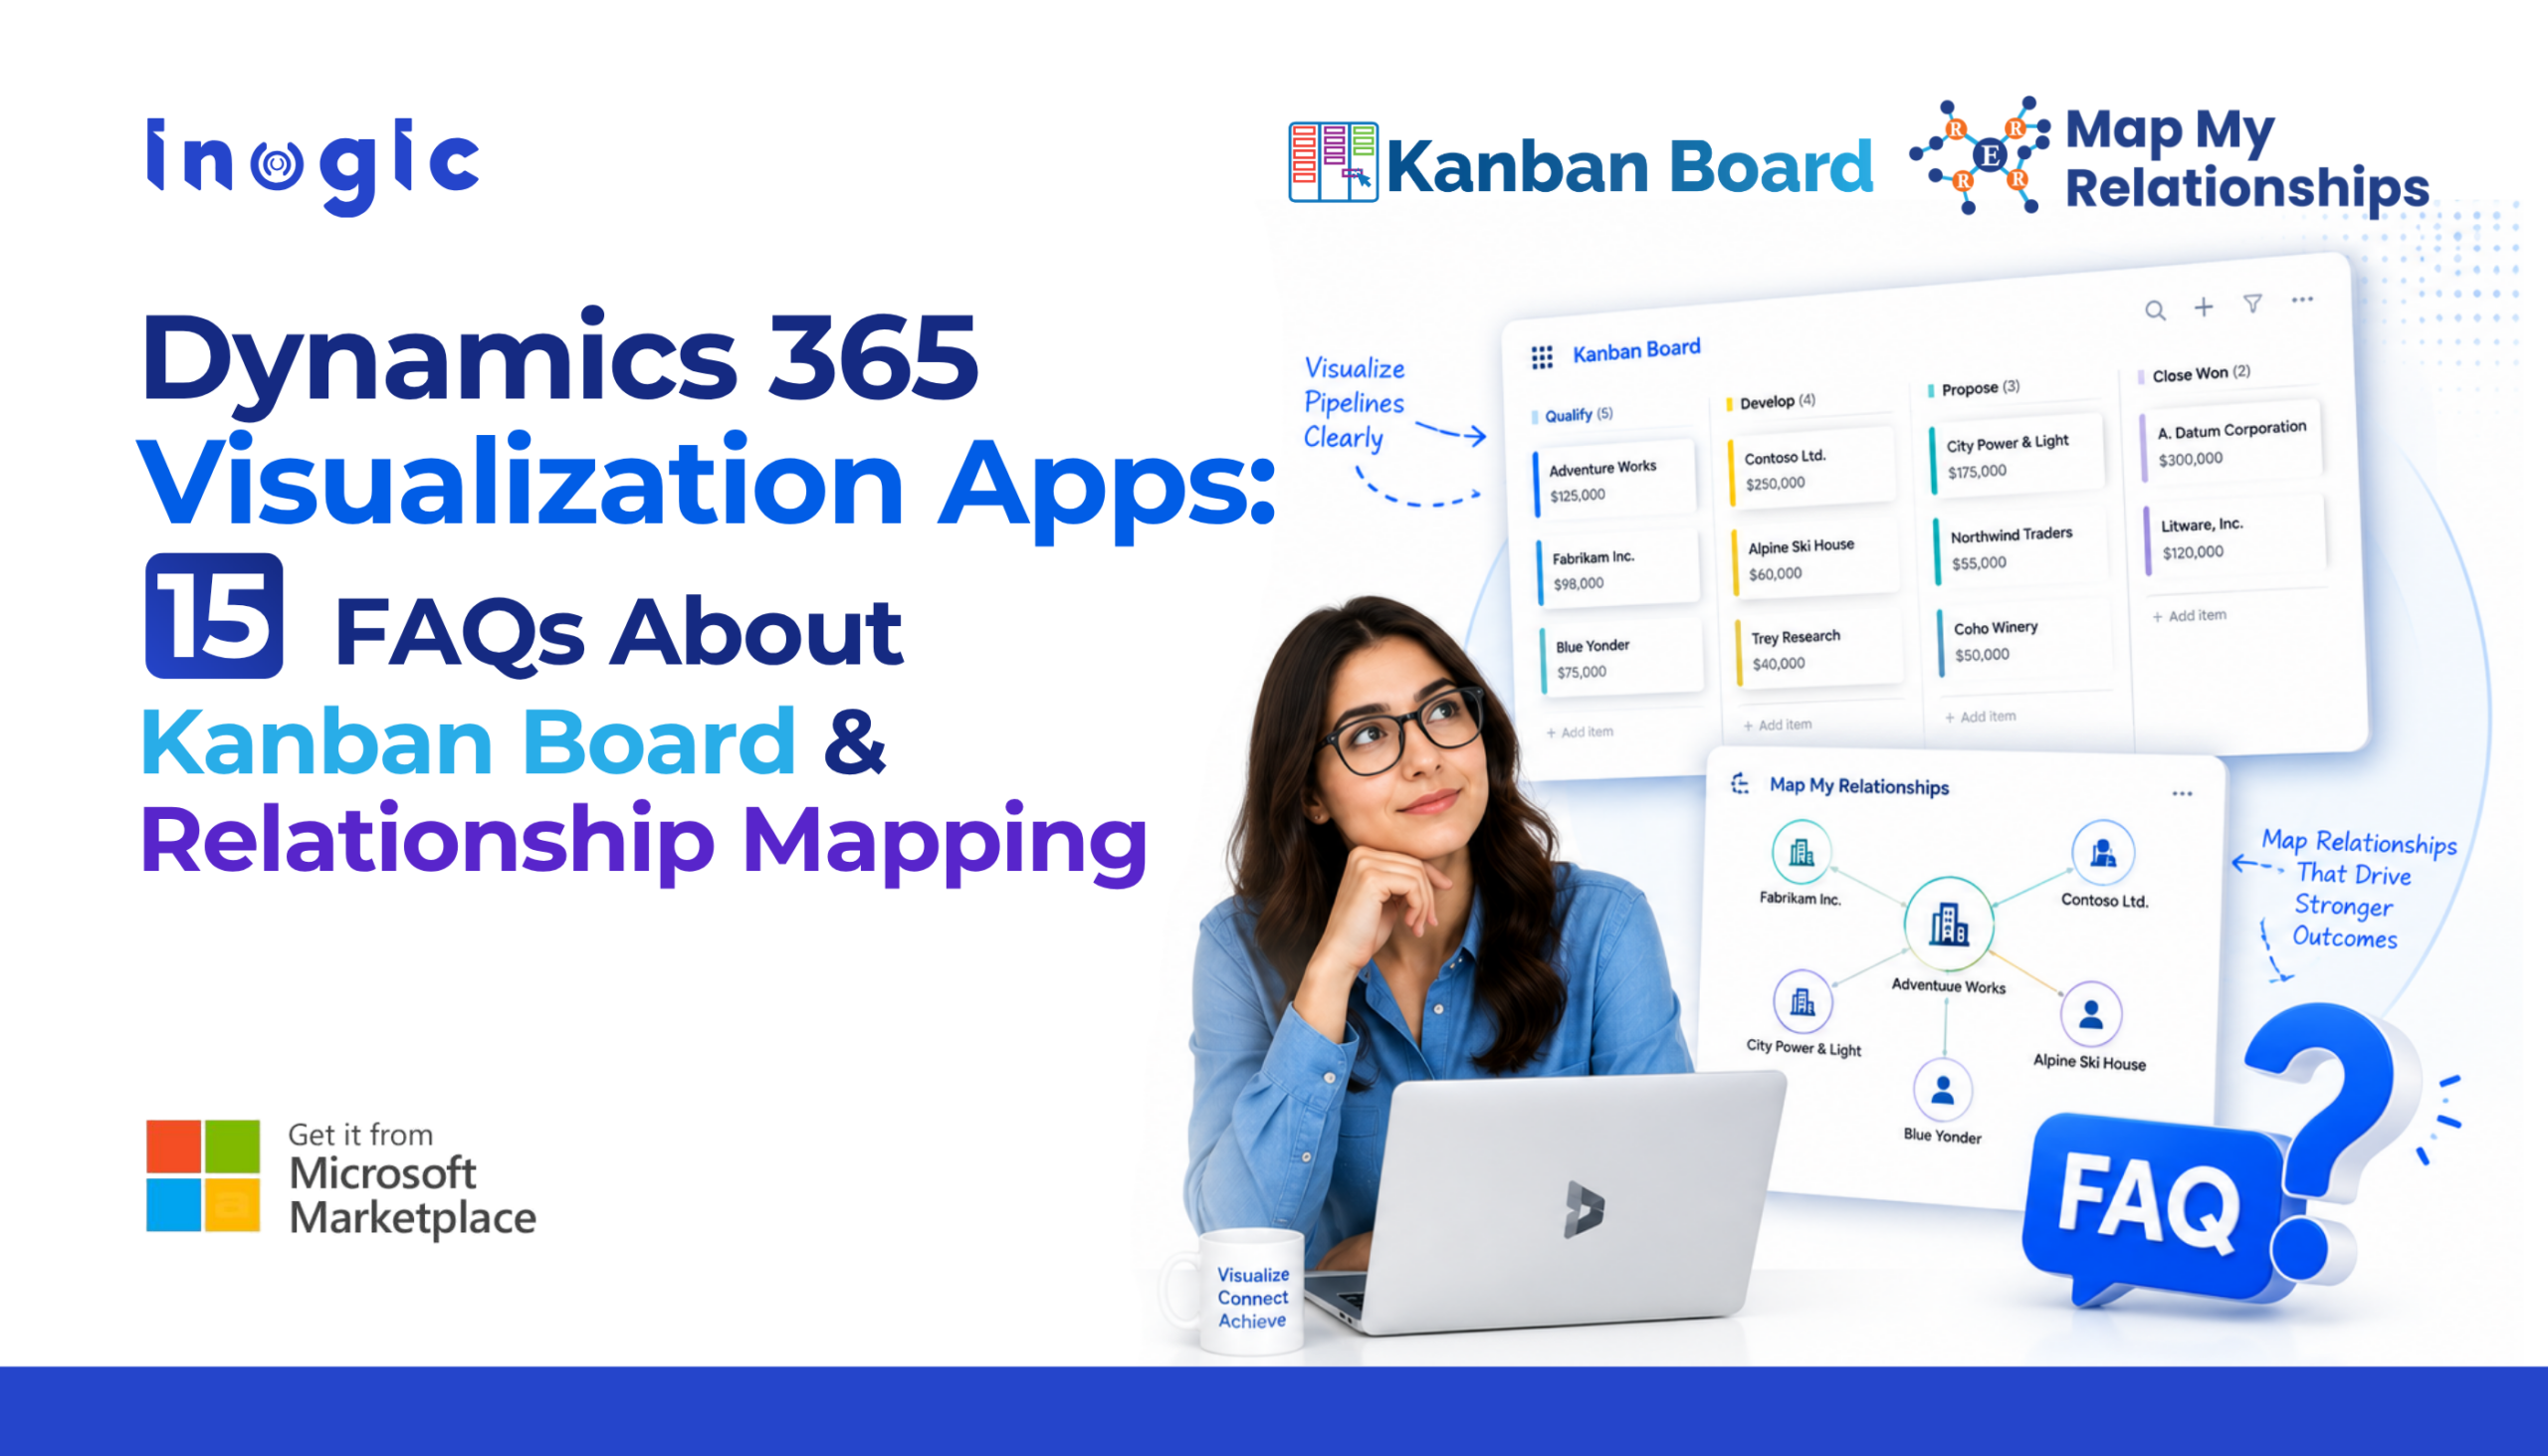 Is your Dynamics 365 CRM helping you make decisions, or just storing data?
If you’ve ever searched for “How do I visualize my Dynamics 365 pipeline?”, “Can Dynamics 365 show relationships between records?”, or “Is there a Kanban view in Dynamics 365?”, you’re not alone.
As organizations adopt Microsoft Dynamics 365 to manage growing volumes of customer data, one challenge remains constant: traditional grid views aren’t always the fastest way to understand complex CRM information.
That’s where Dynamics 365 visualization apps come in.
Whether you want to track opportunities using a Kanban Board or explore relationships between Accounts, Contacts, Opportunities, and custom entities through an interactive mind map, visualization transforms the way users work inside Dynamics 365.
Key Takeaways
- Dynamics 365 visualization apps make CRM data easier to understand through interactive Kanban Boards and relationship maps.
- Kanban Board helps teams visualize and manage workflows, while Map My Relationships reveals connections between CRM records.
- Visual interfaces reduce navigation, improve productivity, and encourage higher CRM adoption.
- Together, these apps provide a faster and more intuitive way to analyze customer data and business processes in Dynamics 365.
To help you get started, we’ve answered the 15 most commonly searched questions about CRM visualization.
1. What are visualization apps in Dynamics 365?
Visualization apps convert traditional CRM records into interactive visual layouts, making information easier to understand and act upon.
Instead of scrolling through lengthy grids, users can view records as:
- Kanban Boards for workflow management
- Mind Maps for relationships and connections
These views make CRM data more intuitive and significantly improve user productivity.
2. Does Dynamics 365 have a Kanban Board?
While Dynamics 365 doesn’t provide an advanced Kanban experience out of the box, Kanban Board by Inogic enables users to visualize CRM records as interactive cards arranged in customizable lanes and rows.
Teams can simply drag and drop records between stages, instantly updating the underlying CRM data without opening individual records.
💡 Did You Know?
Studies show that the human brain processes visual information up to 60,000 times faster than text. That’s one reason why visual CRM interface help users identify bottlenecks much faster than traditional grid views.
3. Can I visualize relationships between records in Dynamics 365?
Yes.
Map My Relationships provides a visual relationship map that displays how Accounts, Contacts, Opportunities, Cases, custom entities, and other records are connected.
Instead of opening multiple forms and related tabs, users can explore relationships through an interactive mind map.
4. How can I view my sales pipeline visually in Dynamics 365?
A Kanban Board is one of the most effective ways to visualize your sales pipeline.
Each opportunity appears as a card that can be moved across stages such as:
- New
- Qualified
- Proposal
- Negotiation
- Won
This gives sales teams an instant overview of pipeline health.
5. What is the difference between a Kanban Board and a Relationship Map?
They solve different business problems.
Kanban Board focuses on workflow visualization – showing where records are in a business process.
Map My Relationships focuses on relationship visualization – showing how records connect with one another across Dynamics 365.
| Feature | Kanban Board | Map My Relationships |
| Best for | Workflow management | Relationship visualization |
| Shows | Pipeline stages | Record connections |
| Ideal users | Sales, Service | Sales, Account Management |
| Helps with | Process tracking | Stakeholder mapping |
Many organizations use both together for a complete CRM visualization experience.
6. Can I update CRM records directly from a Kanban Board?
Absolutely.
Users can:
- Drag and drop cards
- Change record stages
- Update field values
- Perform quick actions
- Create activities
all without opening individual records.
7. How do relationship maps improve CRM productivity?
Relationship maps eliminate unnecessary navigation.
Instead of opening multiple related records one by one, users can:
- explore connected records,
- drill into relationships,
- identify key stakeholders,
- understand customer networks,
from one visual screen.
💡 Did You Know?
Many sales opportunities are influenced by multiple contacts across different departments. A relationship map helps teams discover these hidden connections that often remain buried in traditional CRM views.
8. Can Dynamics 365 display a 360-degree customer view?
Yes.
Using Map My Relationships, users can visualize connected records, activities, emails, appointments, opportunities, and related entities around a primary record, creating a true 360-degree customer view.
9. Can I customize a Kanban Board?
Yes.
Kanban Board by Inogic supports customization such as card layouts, row grouping, lane grouping, card colors, Business Process Flow stages, aggregate values, persona images, filters and sorting, allowing organizations to tailor the board to their unique processes.
10. Can I customize relationship maps in Dynamics 365 CRM?
Absolutely.
Map My Relationships by Inogic allows users to customize: node labels, connection colors, relationship labels, images, grouping, aggregation, and filters, making large relationship networks easier to interpret.
11. Does Kanban Board support Business Process Flows (BPF)?
Yes.
Kanban Board supports Dynamics 365 Business Process Flows, allowing users to visualize CRM records according to each process stage while also supporting Global and Personal BPF Pinning for consistent workflows.
12. Can I explore multiple levels of relationships in Dynamics 365?
Yes.
Map My Relationships supports N-level relationship visualization, allowing users to continue drilling into connected records until they’ve explored every relevant relationship.
This is especially useful for enterprise account structures and complex customer ecosystems.
💡 Did You Know?
Large enterprise accounts often have relationships spanning multiple subsidiaries, contacts, opportunities, and service cases. N-level visualization helps uncover these connections without endless clicking.
13. Should I Use Kanban Board or Map My Relationships?
Both serve different purposes.
Choose Kanban Board if your focus is:
- pipeline tracking
- opportunity management
- case progression
- project workflows
Choose Map My Relationships if you need:
- stakeholder mapping
- customer relationship analysis
- account hierarchies
- connection management
Many organizations use both together.
14. Can visualization apps improve CRM adoption?
Definitely.
One of the biggest reasons users avoid CRM systems is navigation complexity.
Visual interfaces reduce clicks, improve usability, and make CRM significantly easier to understand—leading to higher user adoption.
15. Which Teams Benefit Most from Dynamics 365 Visualization Apps?
Visualization apps are valuable for:
- Sales Teams
- Customer Service Teams
- Project Managers
- Account Managers
- Business Analysts
- CRM Administrators
- Executives monitoring KPIs
Final Thoughts
As CRM data continues to grow, simply storing information isn’t enough. Teams need to see patterns, understand relationships, and act faster.
A Kanban Board gives you a visual command centre for managing workflows, while Map My Relationships uncovers the connections that drive smarter customer engagement. Together, they transform Dynamics 365 from a record management system into a platform for visual decision-making.
Try these apps with a 15-day free trial from Microsoft Marketplace or Inogic’s website.
For more info or a personalized demo, drop a mail at crm@inogic.com.