 AI agents built using Microsoft Copilot Studio are now widely used for customer support, employee self-service, and IT automation. While building an AI agent is easy, monitoring and optimizing it in production is the real challenge.
Organizations frequently need answers to important operational questions such as why conversations are failing, which topics are leading to escalations, why users are abandoning conversations midway, or whether backend APIs are causing delays. Without proper monitoring and diagnostics, the AI agent eventually becomes a black box with very limited visibility into its real-world performance.
This is where integrating Azure Application Insights with Copilot Studio becomes valuable. It provides telemetry, diagnostics, performance monitoring, and operational visibility for enterprise AI agents, helping organizations better understand how their agents behave in production environments.
Once integrated with Copilot Studio, Application Insights can capture valuable telemetry such as conversation start and end events, triggered topics, node execution paths, fallback scenarios, response latency, API performance, errors, exceptions, and dependency tracking for external systems. These insights help organizations proactively monitor, troubleshoot, and optimize their AI agents more effectively.
To better understand how telemetry improves AI operations, consider the following real-world scenario.
Real Business Use Case: AI-Powered Telecom Customer Support
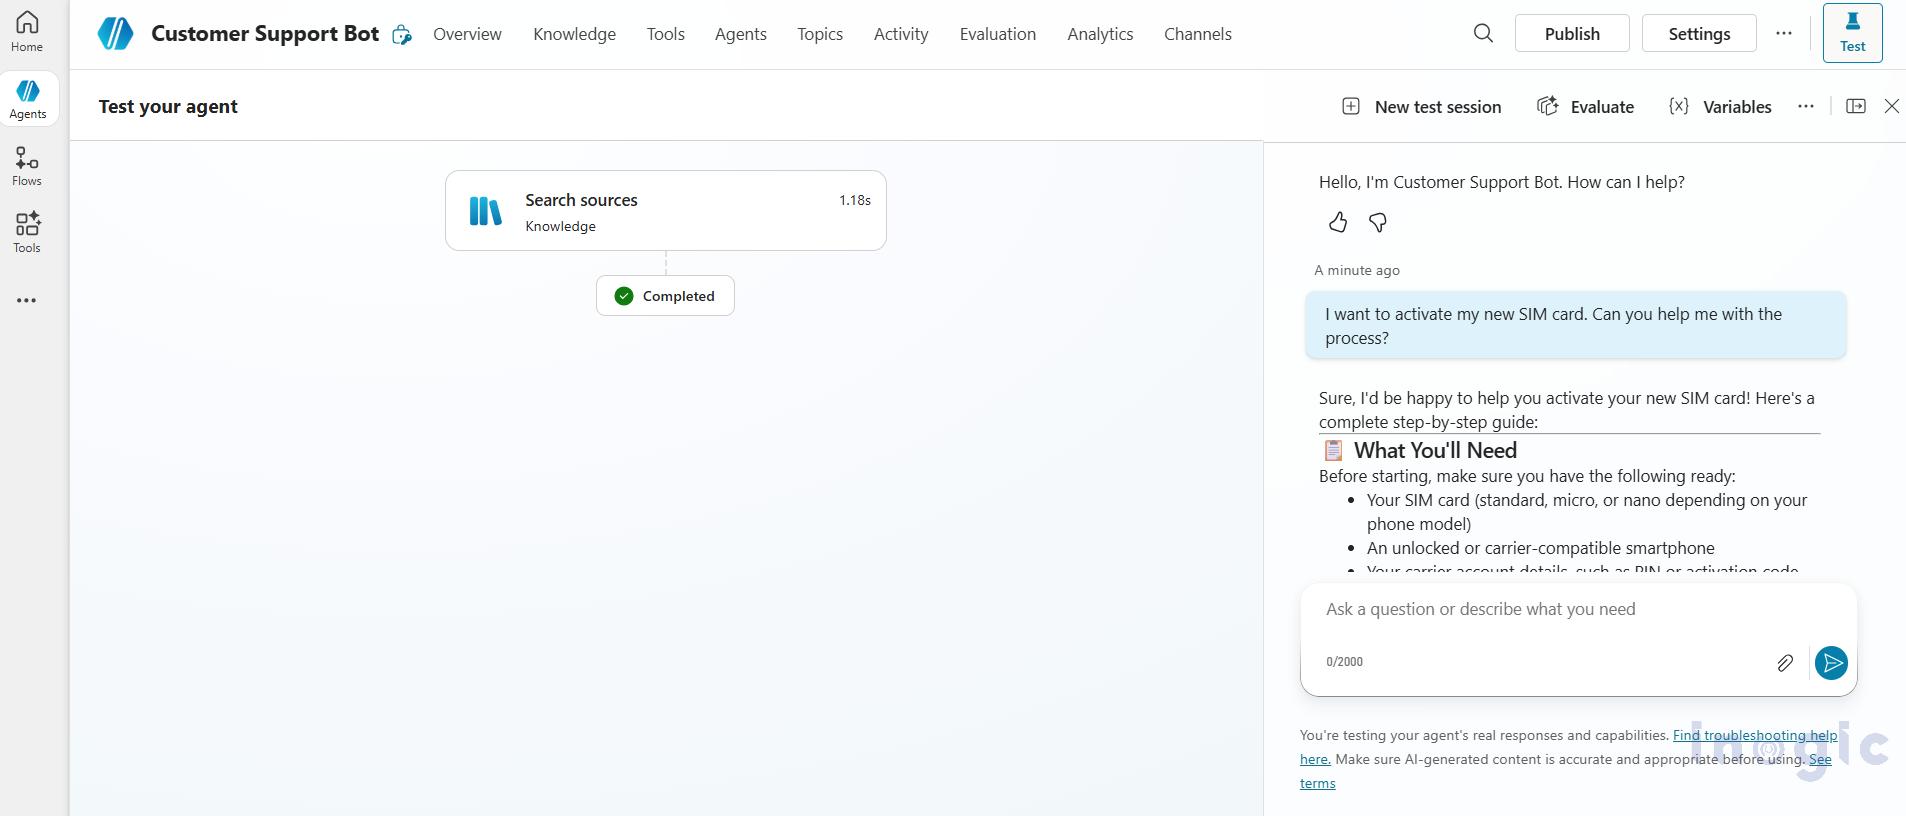
Consider a telecom organization that deploys a Copilot Studio agent to handle customer operations such as SIM activation, recharge assistance, and bill payment support. Initially, the AI agent reduces support workload by automating repetitive customer interactions.
However, after moving to production, the support team begins noticing several operational challenges. This included increase in escalations to human agents, users abandoning conversations midway, and slower response times during specific support journeys.
How Application Insights Helped
Application Insights provided detailed telemetry and operational visibility into the AI agent.
The organization was able to identify:
- The exact conversation flow where users were dropping off
- Topics generating the highest escalation volume
- Backend APIs impacting response performance
- Repeated fallback scenarios affecting customer experience
This improves:
- Customer satisfaction
- Operational efficiency
- AI containment rate
- Support cost reduction
Step-by-Step Integration
Step 1 – Create Application Insights
To create an Application Insights resource, refer to the Microsoft documentation below:
Microsoft Documentation – Create Application Insights Resource
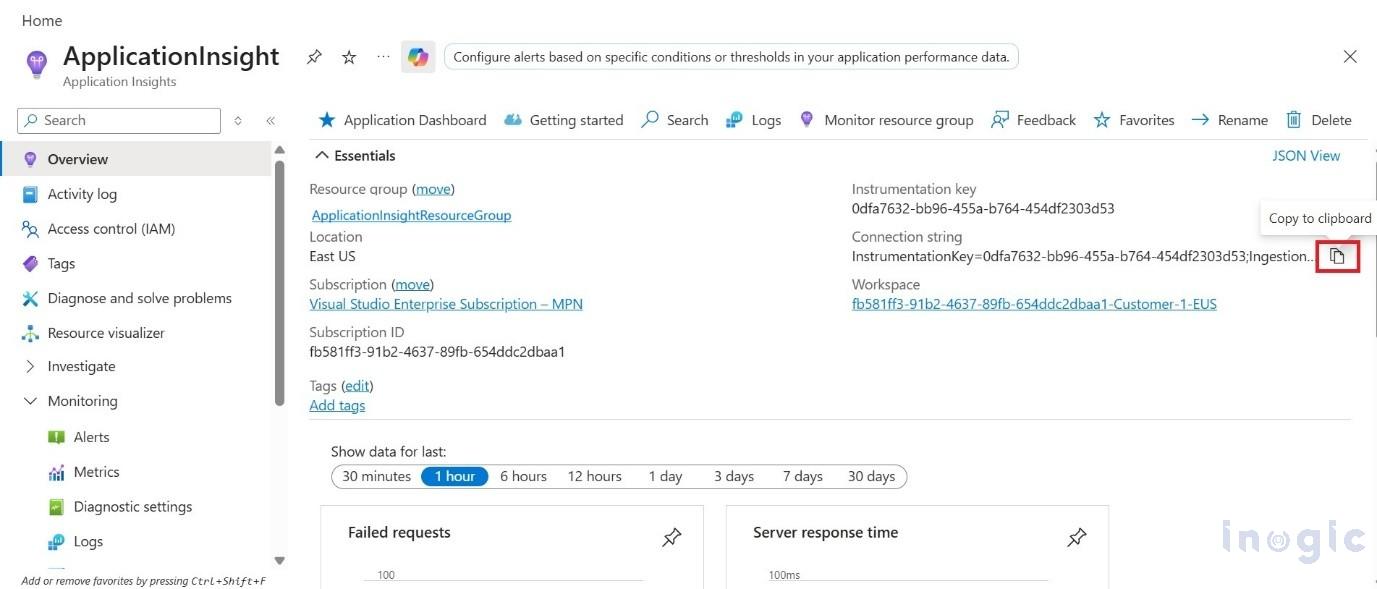
Once the Application Insights resource is created:
- Open the Application Insights resource
- Navigate to Overview
- Copy the Connection String using Copy to clipboard button.
This connection string will be used in Copilot Studio configuration.
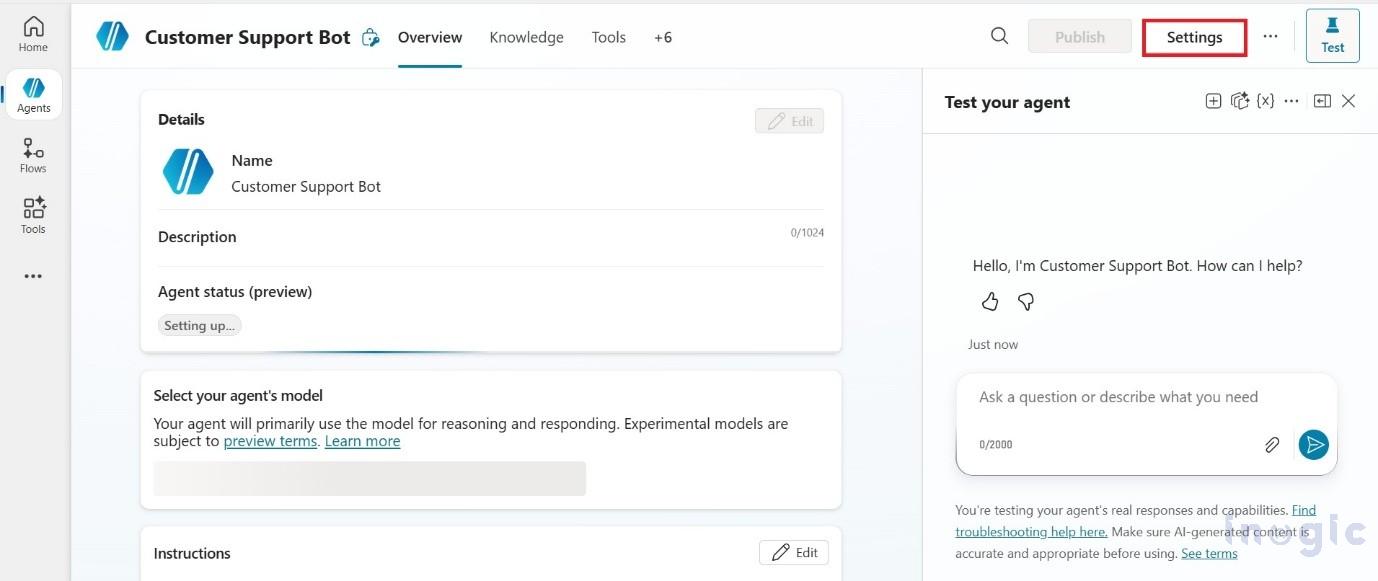
Step 2 – Configure in Copilot Studio
A. Open your agent in Copilot Studio and click the Settings button in the top-right corner.
B. From the Settings page, navigate to the Advanced section available in the left navigation panel. Under Advanced, locate the Application Insights section, where you can configure the Connection String along with additional logging and telemetry options.
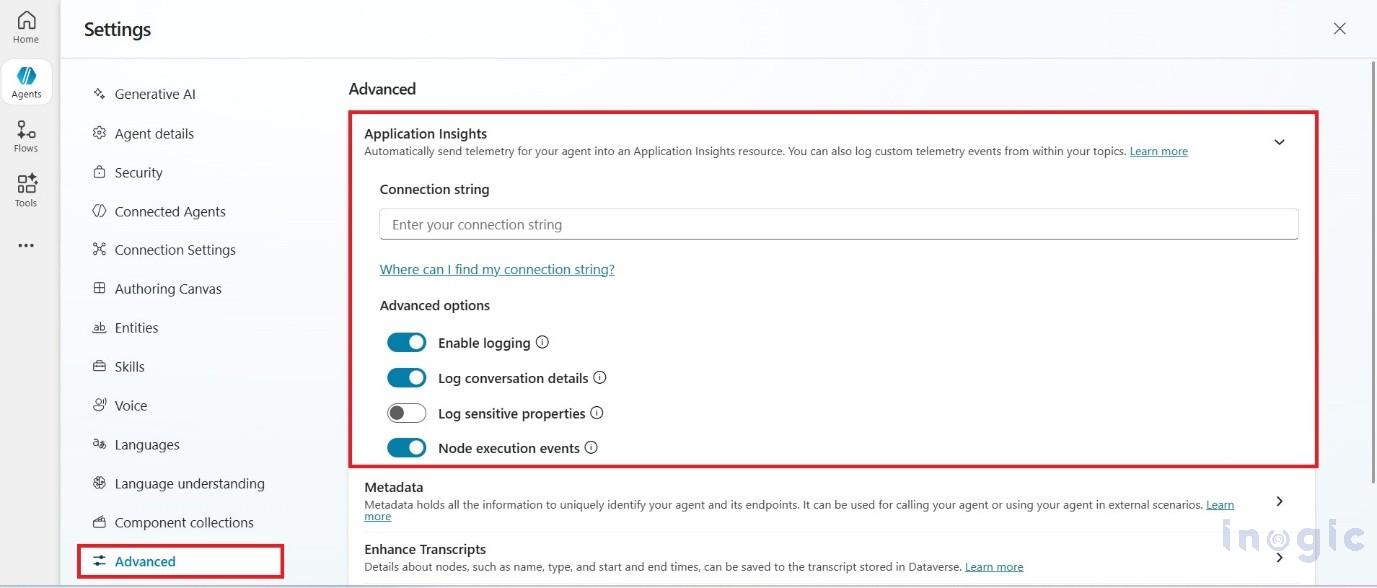
C. Save the configuration.
Step 3 – Publish and Test
Publish the agent and trigger conversations to generate telemetry.
Step 4 – Verify flow in Application Insights
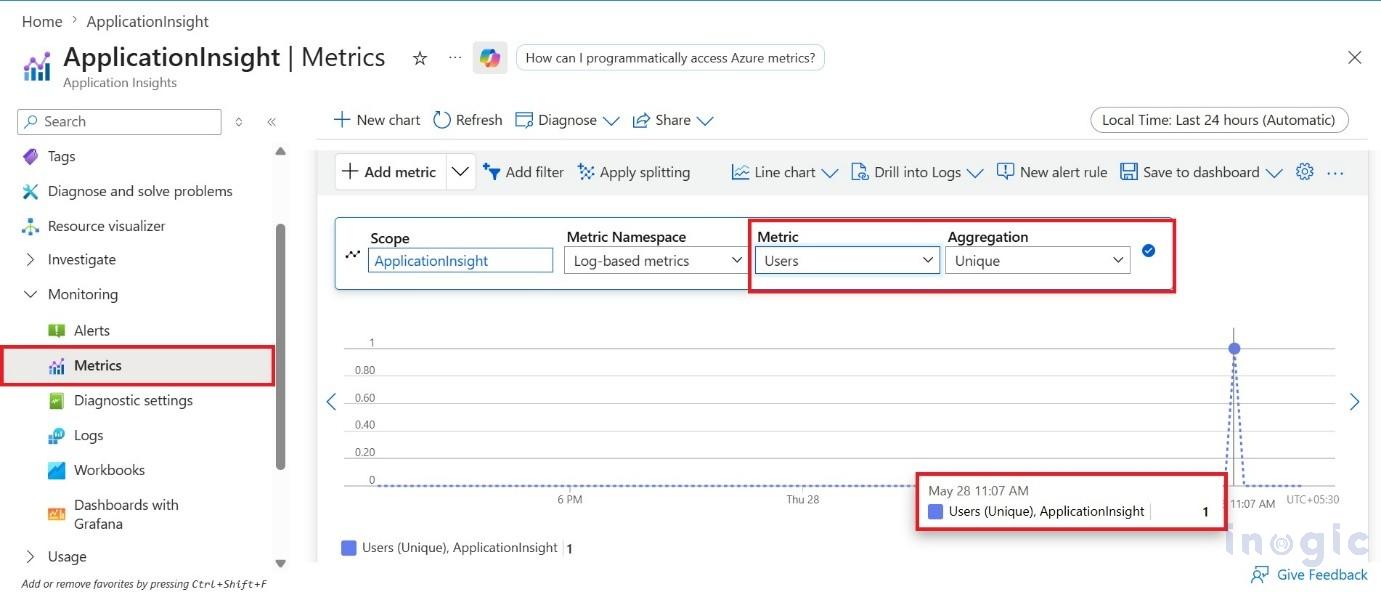
- Return to the Application Insights resource in the Azure portal and navigate to Monitoring → Metrics.
- Select Users as the metric and choose Unique as the aggregation type. After running a few test conversations, you should be able to see at least one unique user reflected in the metrics data.
Query Telemetry Data with KQL
One of the most powerful capabilities of Application Insights is the ability to analyze telemetry data using Kusto Query Language (KQL).
After telemetry data begins flowing into Application Insights, administrators can use KQL to analyze conversation behavior, performance trends, user interactions, and AI agent activity in greater detail.
To explore the conversation telemetry:
- Open your Application Insights resource in the Azure portal
- Navigate to Monitoring → Logs
- Enter the following KQL query to retrieve conversation details from the test pane, including message-level telemetry:
customEvents
| extend text = customDimensions[‘text’],
fromName = customDimensions[‘fromName’],
designMode = customDimensions[‘DesignMode’]
| where designMode == “True”
| project timestamp, name, text, fromName
| order by timestamp asc
The query results provide detailed visibility into the complete conversation lifecycle between the user and the Copilot Studio agent.
A. BotMessageReceived: Indicates that the user’s message was received by the agent
B. TopicStart: Represents the start of a triggered topic
C. TopicAction: Captures actions being executed within the topic flow
D. GenerativeAnswers: Shows AI-generated responses created by the agent
E. BotMessageSend: Indicates that the response was sent back to the user
F. TopicEnd: Marks the completion of the topic execution flow
Below are some useful KQL Queries you can use:
1. Show only production data:
customEvents
| extend isDesignMode = customDimensions[‘DesignMode’]
| where isDesignMode == “False”
2.Count of unique user per day for last 14 days
let queryStartDate = ago(14d);
let queryEndDate = now();
let groupByInterval = 1d;
customEvents
| where timestamp > queryStartDate
| where timestamp < queryEndDate
| summarize uc=dcount(user_Id) by bin(timestamp, groupByInterval)
| render timechart
3. View generative answer events with sources:
customEvents
| where name == “GenerativeAnswers”
| extend cd = todynamic(customDimensions)
| project timestamp, Sources = cd[‘Sources’], Result = cd[‘Result’]
| order by timestamp desc
Conclusion
Copilot Studio helps organizations build AI agents quickly, but Application Insights provides the monitoring layer required to run them successfully in production. With proper telemetry, organizations can monitor failures, optimize conversations, improve performance, and build enterprise-grade AI solutions.
FAQs
How do I integrate Application Insights with Copilot Studio?
Create an Application Insights resource in Azure, copy the connection string, and configure it within the Application Insights settings under the Advanced section in Copilot Studio. After saving the configuration, publish the agent to begin collecting telemetry data.
What telemetry does Application Insights capture for Copilot Studio agents?
Application Insights can capture conversation events, topic execution details, user interactions, fallback scenarios, response latency, API performance metrics, exceptions, and dependency tracking information.
Can Application Insights monitor Copilot Studio conversations?
Yes. Application Insights provides visibility into conversation lifecycles, including user messages, topic triggers, AI-generated responses, conversation completion events, and escalation patterns.
What is Kusto Query Language (KQL) in Application Insights?
KQL is a query language used in Azure Monitor and Application Insights to analyze telemetry data, investigate issues, identify trends, and create operational reports.
Why should I use Application Insights with Copilot Studio?
The integration helps organizations monitor AI agent performance, identify failures, analyze user behavior, troubleshoot issues faster, and continuously improve conversational experiences.
Can I track Generative AI responses in Copilot Studio using Application Insights?
Yes. Application Insights captures GenerativeAnswers events, allowing administrators to analyze AI-generated responses, review sources, and evaluate answer quality.