 In complex B2B sales, deals are rarely won through a single contact – they’re won through networks of decision-makers, influencers, and stakeholders.
Yet most CRM systems, including Dynamics 365, present this data in flat lists, making it difficult to understand who influences whom and how deals actually move forward.
That’s where Map My Relationships – changes the game.
Here’s how a US-based technology distribution company used it to transform their account management and close deals faster.
What You’ll Learn in This Blog:
- Why flat CRM views create relationship blind spots
- How relationship mapping improves deal visibility
- Real results from a US-based Dynamics 365 team
- How to act on relationship insights inside CRM
The Challenge: Invisible Relationships, Missed Revenue
A mid-market technology distributor headquartered in Dallas, Texas, operates across 14 US states and manages over 600 active enterprise accounts inside Microsoft Dynamics 365 CRM. Their sales team – 45 reps and 8 account executives – were struggling with a common but costly problem: relationship blind spots.
Despite thorough CRM hygiene, account teams had no way to visualize –
- How are their contacts related to each other inside an account?
- Who reported to whom?
- Which VP was the real budget owner?
- Was the procurement director connected to a competitor’s board member?
These questions required hours of manual research, cross-referencing notes, and back-and-forth emails – before a single call could be made.
“We had all the data in Dynamics 365. What we couldn’t do was see it. Contacts were isolated records, not a network. We were flying blind into six-figure deals.”
The team needed a way to visualize Dynamics 365 relationship maps, identify key stakeholders and influencers, and act on that intelligence – all without leaving CRM.
The Solution: Map My Relationships for Dynamics 365
The company deployed Map My Relationships across its sales team, with full rollout completed in under a week and no custom development required.
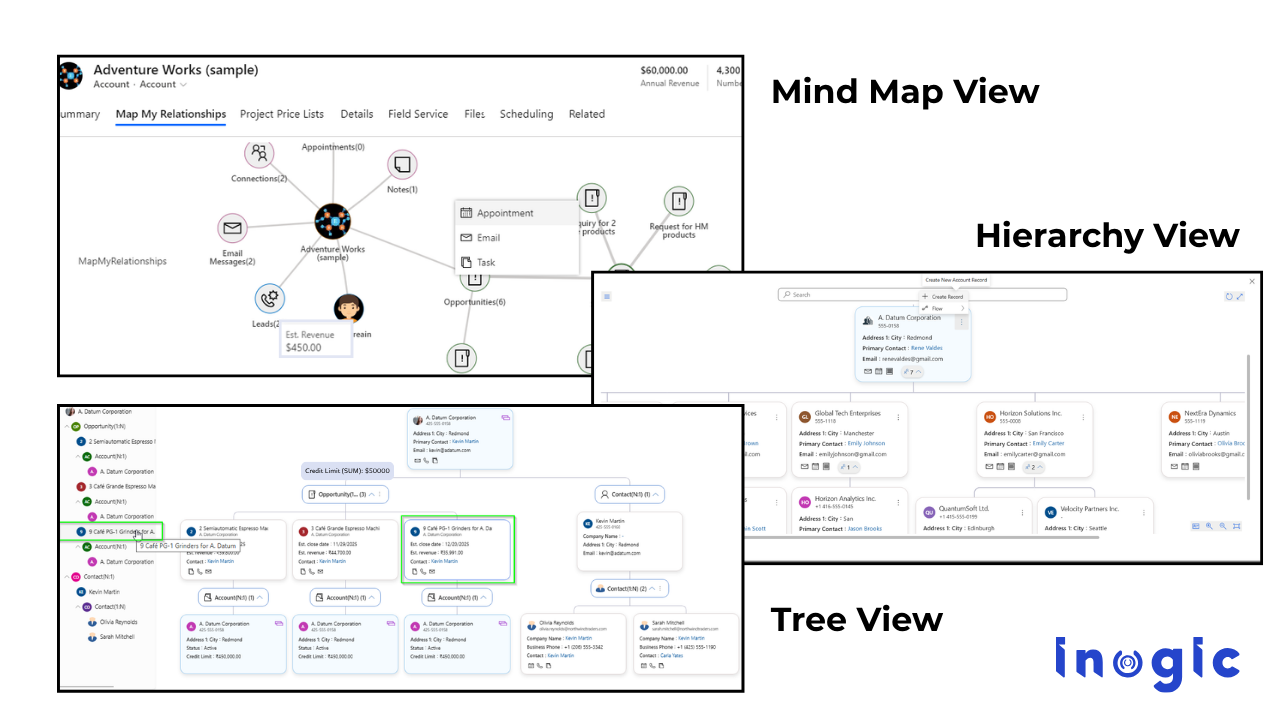
The app transformed how the team experienced their CRM data through three core visualization modes:
Mind Map View:
An interactive relationship graph showing all connected accounts, contacts, and opportunities from a single record, like a visual Dynamics 365 relationship chart.
Tree View:
A parent-child account hierarchy in Dynamics 365 makes complex ownership structures and subsidiaries instantly navigable.
Hierarchy Control:
A full org chart view for Dynamics 365, drill into N-levels of stakeholder structures, and navigate directly to any related record.
Color-Coded Influence Mapping:
Connection roles are color-coded, so reps instantly identify decision-makers, influencers, and blockers across every account.
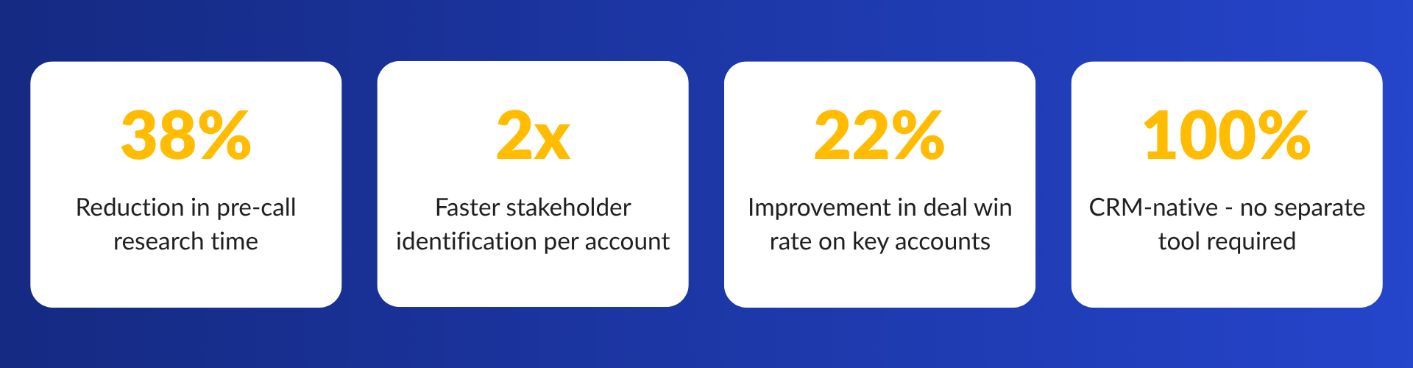
The Results: Faster Deals, Sharper Strategies
Within 90 days of deploying Map My Relationships, the Dallas-based team reported measurable improvements across their pipeline and account management workflows.
Influence Mapping Changed How They Sell
Using the mind map view, account executives could now perform influence mapping directly inside Dynamics 365, identifying not just who the contacts were, but how they were connected and which relationships carried the most weight. Reps began building multi-threaded strategies targeting financial decision-makers, technical evaluators, and executive sponsors simultaneously.
Org Charts Replaced Guesswork
The hierarchy control view gave the team a live org chart inside Dynamics 365, reflecting actual parent-child reporting structures rather than static org diagrams stored on SharePoint. When accounts are reorganized – common in US enterprise – the CRM relationship view is updated automatically.
Activities Launched from the Relationship Map
With Map My Relationships, reps could create tasks, emails, and phone calls directly from the visual Dynamics 365 relationship view, without switching tabs. Activities linked automatically to the right contact and account, reducing CRM data entry errors significantly.
Why Map My Relationships Works for US Enterprise CRM Teams
US B2B sales cycles are long and multi-stakeholder. A single enterprise account can involve procurement, IT, finance, legal, and C-suite contacts, each with different priorities and influence levels. Traditional Dynamics 365 record views were never designed to surface these dynamics.
Map My Relationships bridges that gap by converting raw CRM data into actionable relationship intelligence for Dynamics 365. It doesn’t require a separate BI tool, third-party visualization platform, or custom-built org chart module. Everything lives inside Dynamics 365.
Key capabilities purpose-built for US enterprise teams include:
- Account Relationship Map:
See how every contact, opportunity, and subsidiary account connects in a single visual workspace, the most intuitive account relationship map in Dynamics 365 available on Microsoft Marketplace.
- Dynamics 365 Account Hierarchy:
Navigate parent-child account hierarchies with tree navigation panels that expand N-levels deep, essential for companies managing regional subsidiaries, channel partners, and holding structures across US states.
- Mind Map for Dynamics 365:
The mind map view is the fastest way to get a 360° relationship snapshot before any customer interaction, whether a new logo meeting or a renewal negotiation.
Frequently Asked Questions
How do you visualize relationships in Microsoft Dynamics 365?
Map My Relationships lets you visualize Dynamics 365 relationship maps using mind map, tree view, and hierarchy control views, all native inside the Dynamics 365 CRM. No external tools or custom development required.
What is influence mapping in Dynamics 365?
Influence mapping in Dynamics 365 means visually identifying decision-makers, power sponsors, and blockers within an account’s relationship network. Map My Relationships uses color-coded connection roles and interactive graphs to surface stakeholder influence at a glance.
Can I see an account hierarchy or org chart in Dynamics 365?
Yes. Map My Relationships provides a hierarchy control view that renders parent-child org charts for accounts and contacts in Dynamics 365, navigable across multiple levels from a single panel.
Is Map My Relationships available for US Dynamics 365 customers?
Yes. Map My Relationships is available on Microsoft Marketplace globally, including for US-based Dynamics 365 Online customers. A free trial is available with no credit card required.
Can relationship mapping improve win rates in Dynamics 365?
Yes. By identifying decision-makers, influencers, and hidden stakeholders, relationship mapping helps sales teams build stronger engagement strategies and close deals faster.
Conclusion:
Your CRM already contains the data you need to win deals—contacts, connections, and hierarchies
What’s missing is visibility.
Map My Relationships transforms that hidden data into actionable relationship intelligence, helping your team move faster, engage smarter, and close more deals.
Start your 15-day free trial of Map My Relationships from the Inogic Website or Microsoft Marketplace and see your Dynamics 365 relationships come to life..
Need a strategic demo for your Dynamics 365 CRM data? Reach us at crm@inogic.com and talk with our experts.