 Microsoft just pushed one of its most practical Power BI updates of the year. Here is everything that changed, explained.
What is in the April 2026 Update?
Power BI’s April 2026 release focuses on three core areas: AI and Copilot, reporting and visuals, and data modeling. There are also a few important deprecations every user should know about.
Here is a quick summary before we dive in:
| Category | What Changed |
| Copilot & AI | Full chat experience now available on mobile |
| Reporting | Base theme switcher, fixed card sizing |
| Modeling | Direct Lake calculated columns, DAX functions. |
| Deprecations | Old file picker gone, Q&A retiring Dec 2026 |
| New Visuals | Date Picker by Powerviz, Waterfall PRO by ZoomCharts |
1. Copilot Is Now Fully Conversational on Mobile
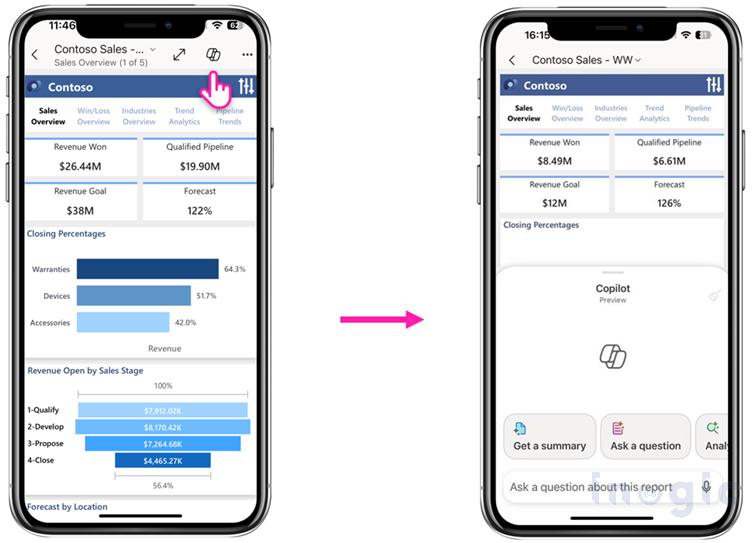
This is the biggest feature in this update. Copilot in Power BI Mobile has been upgraded from a basic summarizer to a full conversational AI assistant.
Ask Questions and Get Real Answers on the Go
- Type plain English questions like “Which region had the best sales this month?”
- Get AI-generated visuals instantly on your phone
- Drill into KPIs without opening a laptop
- Have a full back-and-forth conversation with your report data
Why it matters: Sales managers, field teams, and executives who are always on the move can now get real answers from their data without waiting to get back to their desks.
Also Read :
2. Report Formatting Is Now Easier to Control
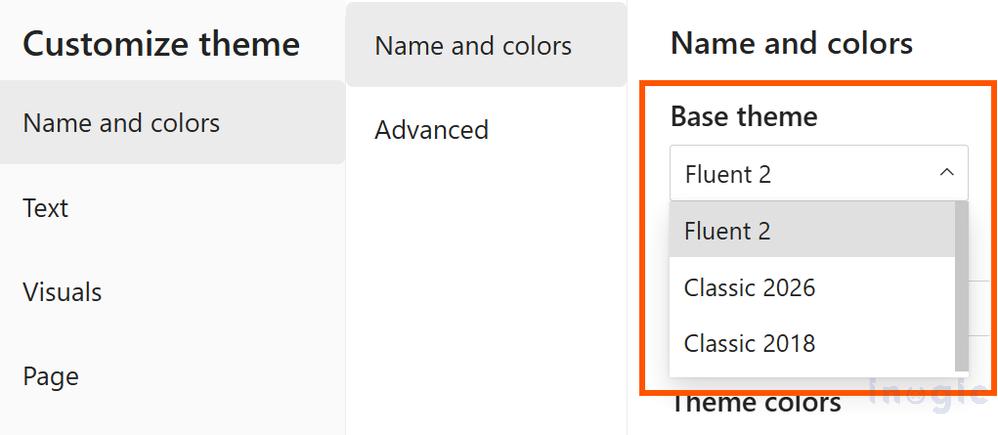
Switch Between Themes Without Breaking Your Report
Tired of your custom-branded report breaking every time Microsoft updates the default theme? This update adds a base theme switcher inside the View ribbon > Themes > Customize current theme dialog.
You can now:
- Toggle between the new modern default and the older base theme
- Update older reports to the latest look in one click
- Protect your custom designs from being overwritten
Set an Exact Size for Every Card Visual
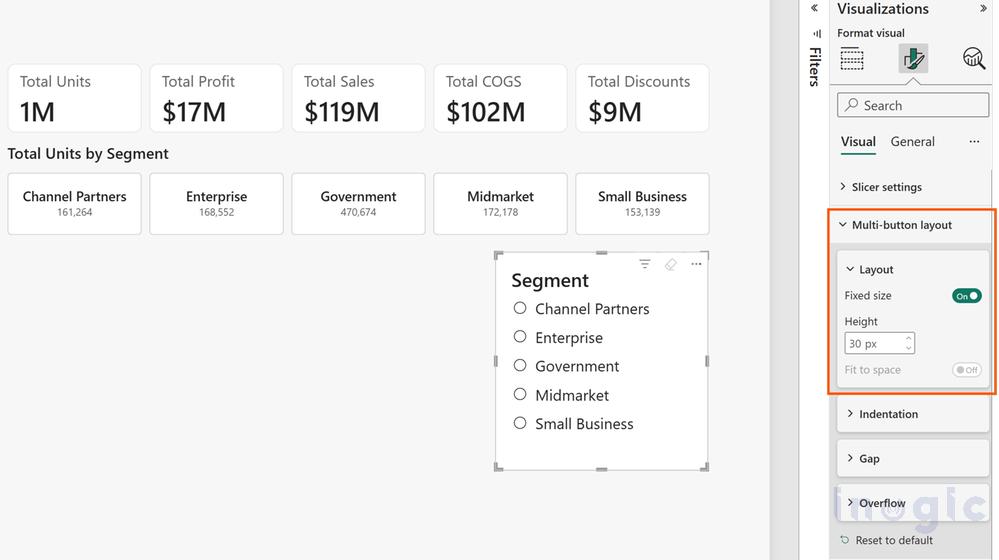
Cards (those boxes showing numbers like Total Revenue or Open Tickets) now support exact pixel sizing. For teams investing in professional data visualization services, this level of formatting control makes a real difference in how polished and credible a dashboard looks to leadership or clients.
| Before | After |
| Cards auto-resized and looked uneven. | Set the exact width and height for each card. |
| No scroll control | Scrollbars appear automatically when needed. |
| “Autogrid” option | Renamed to “Fit to Space” for clarity |
Clean, consistent cards make dashboards look professional and trustworthy, especially when presenting to clients or leadership.
3. Large Datasets Now Refresh and Calculate Faster
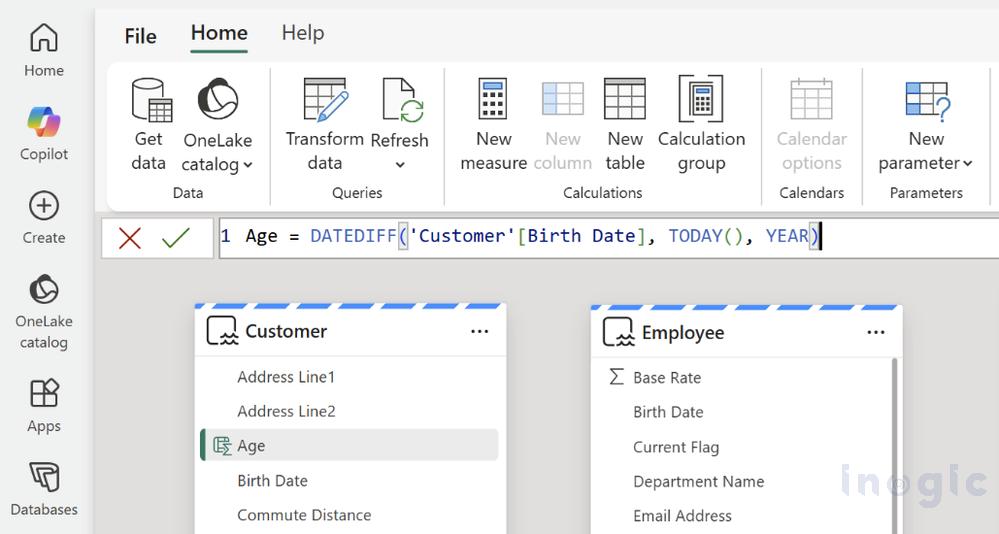
Direct Lake Now Supports Calculated Columns Without a Full Refresh
Direct Lake lets you query data straight from Microsoft OneLake without duplicating it. Until now, adding calculated columns required a full dataset refresh, which could take hours for large datasets.
With April’s update:
- Calculated columns and tables work in Direct Lake without waiting for refreshes
- Faster insights from large enterprise datasets
- Huge time saver for Dynamics 365 users with complex data models
Write a DAX Formula Once and Reuse It Everywhere
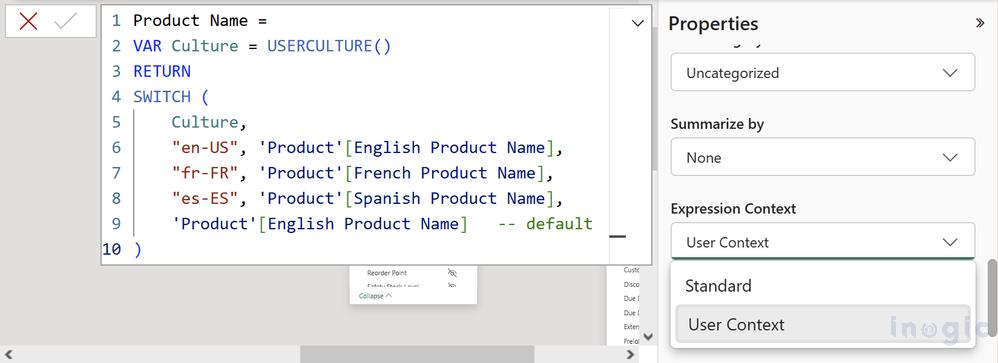
DAX is Power BI’s formula language. Instead of copying the same complex formula across 10 places in your report, you can now:
- Write the logic once
- Name it as a custom function
- Reuse it anywhere in your model
This keeps reports cleaner, reduces errors, and makes maintenance far easier when business rules change.
4. These Features Are Being Removed: Plan Ahead
These are not new features. These are things going away that you need to act on.
| Feature | Status | Deadline |
| Old File Picker | Already removed (April SU04) | Done |
| Q&A Natural Language Tool | Being retired | December 2026 |
| Scorecard Hierarchies | Already removed | April 15, 2026 |
| Netezza Built-in ODBC Driver | Being phased out | Plan soon |
What to do: If your team uses the Q&A tool regularly, start introducing Copilot now so the switch feels natural before December.
5. Two New Visuals Added to the Marketplace
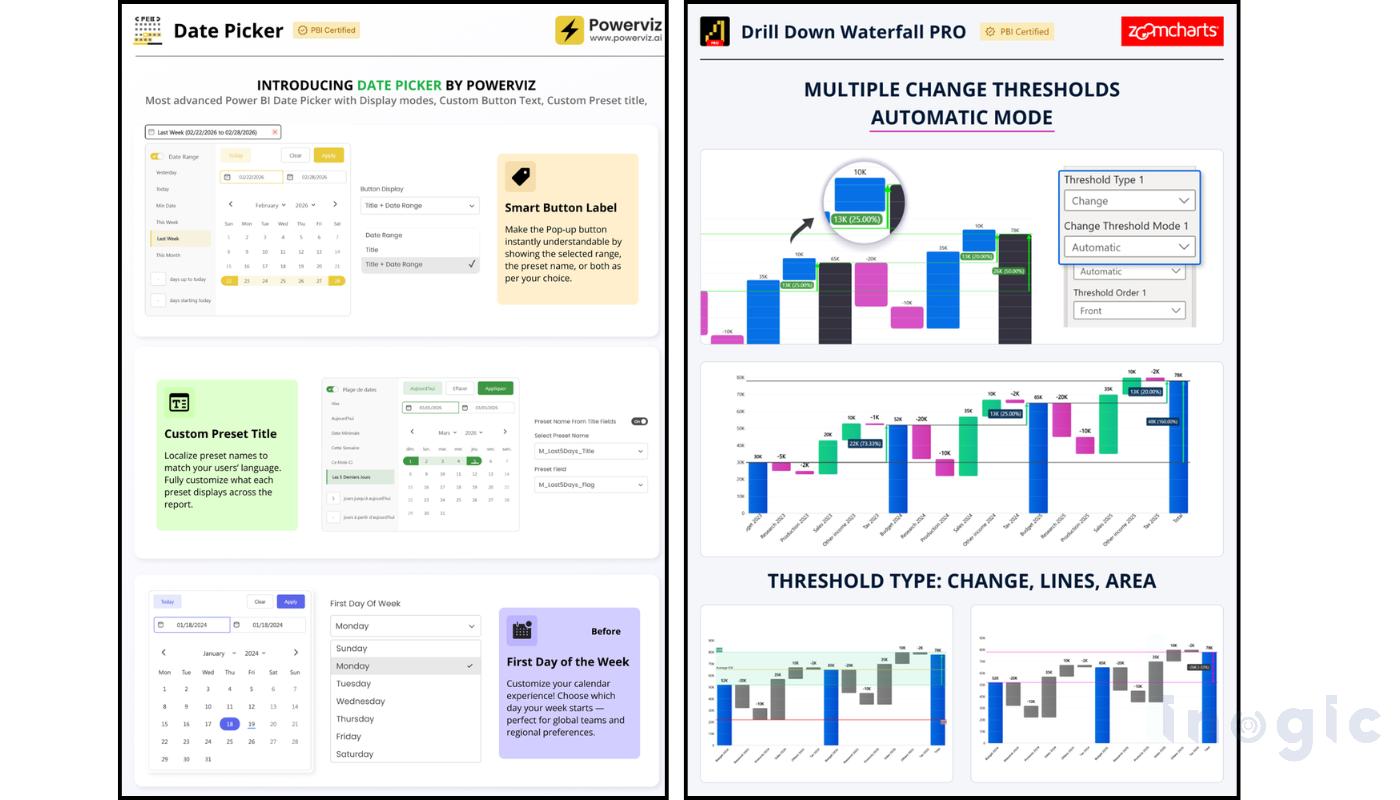
Date Picker by Powerviz: A cleaner, more intuitive date filter for report viewers. Much easier to use than the default date slicer, especially for non-technical users.
Drill Down Waterfall PRO by ZoomCharts Interactive waterfall charts where you can click into each bar to drill deeper. Perfect for financial reporting, budget variance, and sales movement tracking.
Both are available directly in the Visualizations pane in Power BI Desktop.
Full Feature Summary at a Glance
| Feature | Type | Who Benefits Most |
| Copilot on Mobile | Generally Available | Business users, managers |
| Base Theme Switcher | Generally Available | Report designers |
| Fixed Card Sizing | Generally Available | Dashboard builders |
| Direct Lake Columns | Preview | Data engineers, analysts |
| DAX User Functions | Preview | Power users, developers |
| Date Picker Visual | New Visual | All users |
| Waterfall PRO Visual | New Visual | Finance, sales teams |
Want to unlock the full potential of Power BI and its latest Copilot capabilities?
Inogic helps businesses turn data into decisions by building end-to-end analytics solutions, connecting Dynamics 365, optimizing data pipelines, and enabling AI-powered insights with Copilot.
Whether you’re just getting started or looking to scale your reporting, we ensure your Power BI setup is built to deliver real business value.
Explore more at https://www.inogic.com or reach our to us at crm@inogic.com for a personalized consultation.