Introduction
The Pipeline feature in Dynamics 365 Sales is designed to improve the management of Opportunities, providing a more efficient approach for both managers and salespersons. This feature allows users to have a clear understanding of their entire deals in the pipeline, enabling quicker comprehension of relevant information and facilitating prompt decision-making. Additionally, the new enhancement enables users to group opportunities based on specific criteria and aggregation of numeric values such as Estimated revenue of opportunity, allowing for a more customized and organized view of their sales data.
Business use Case
Suppose, you notice that there are a large number of opportunities in your table. Out of them, some are smaller deals with a local business like A Datum Fabrication and another is a larger contract with a multinational corporation like Contoso Electronics. By utilizing this new feature, you can discover that multinational deals have much higher estimated revenue compared to local business deals.
So, you can now prioritize your efforts and resources towards the multinational deals, as it has a greater impact on the overall profits of the company as compared to the other small deals. This allows you to focus more of your team on opportunities that are more beneficial for your company’s profit.
Configuration
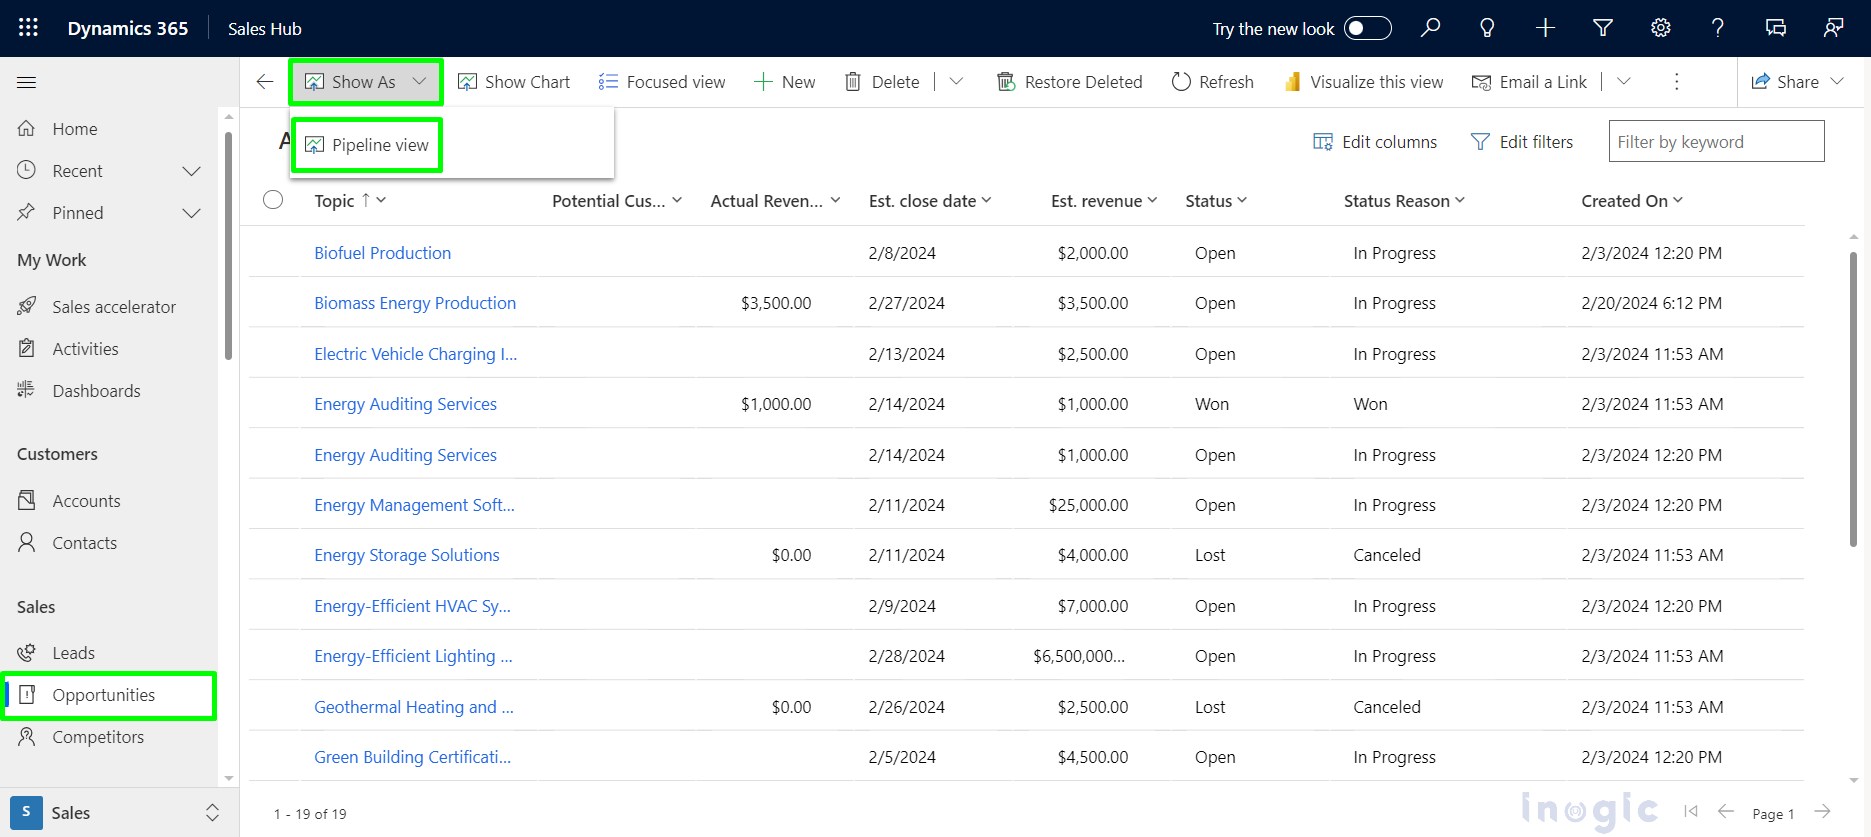
- Navigate to Sales Hub → Opportunity Entity from sitemap.
- Move to the Ribbon bar → click on the dropdown arrow of the Show as button and the Pipeline view button will be displayed → click on the Pipeline view button as shown in the below screenshot.
After clicking on the Pipeline view, the interface will be as shown in the screenshot below.
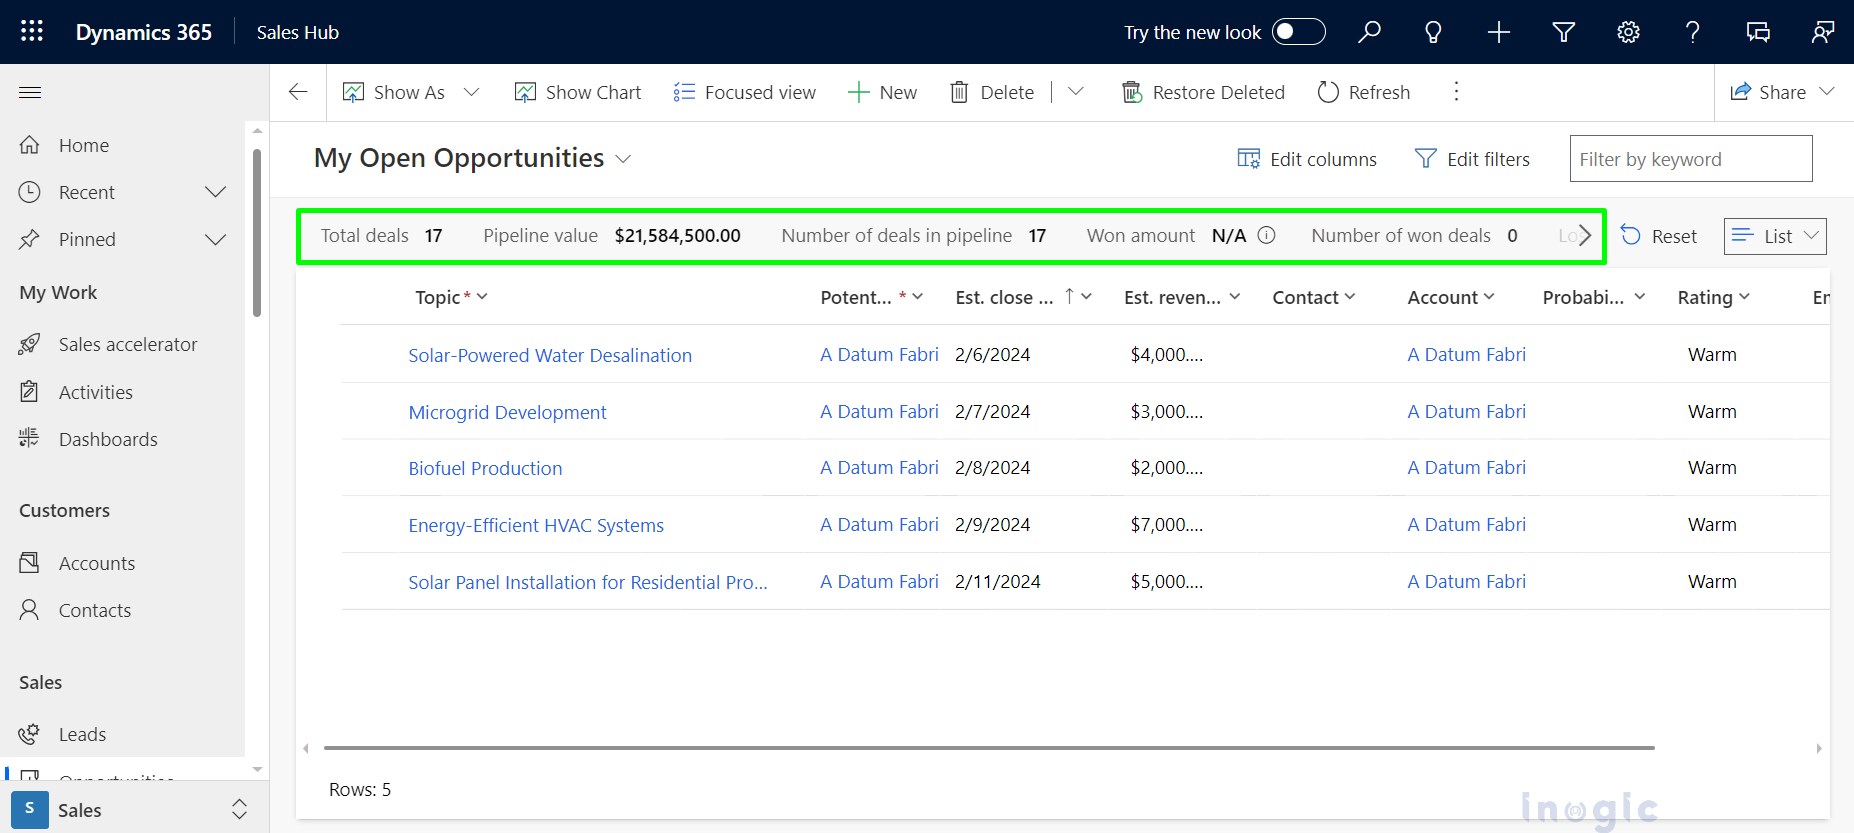
Here, Opportunities are by default summarized with Total Deals, Pipeline Value, Number of deals in the Pipeline, Won Amount, Number of Owned deals, Lost Amount, etc.
- Also, the user can see more summarized information fields by clicking on these “<” & “>” arrow symbols as shown in the below screenshot.
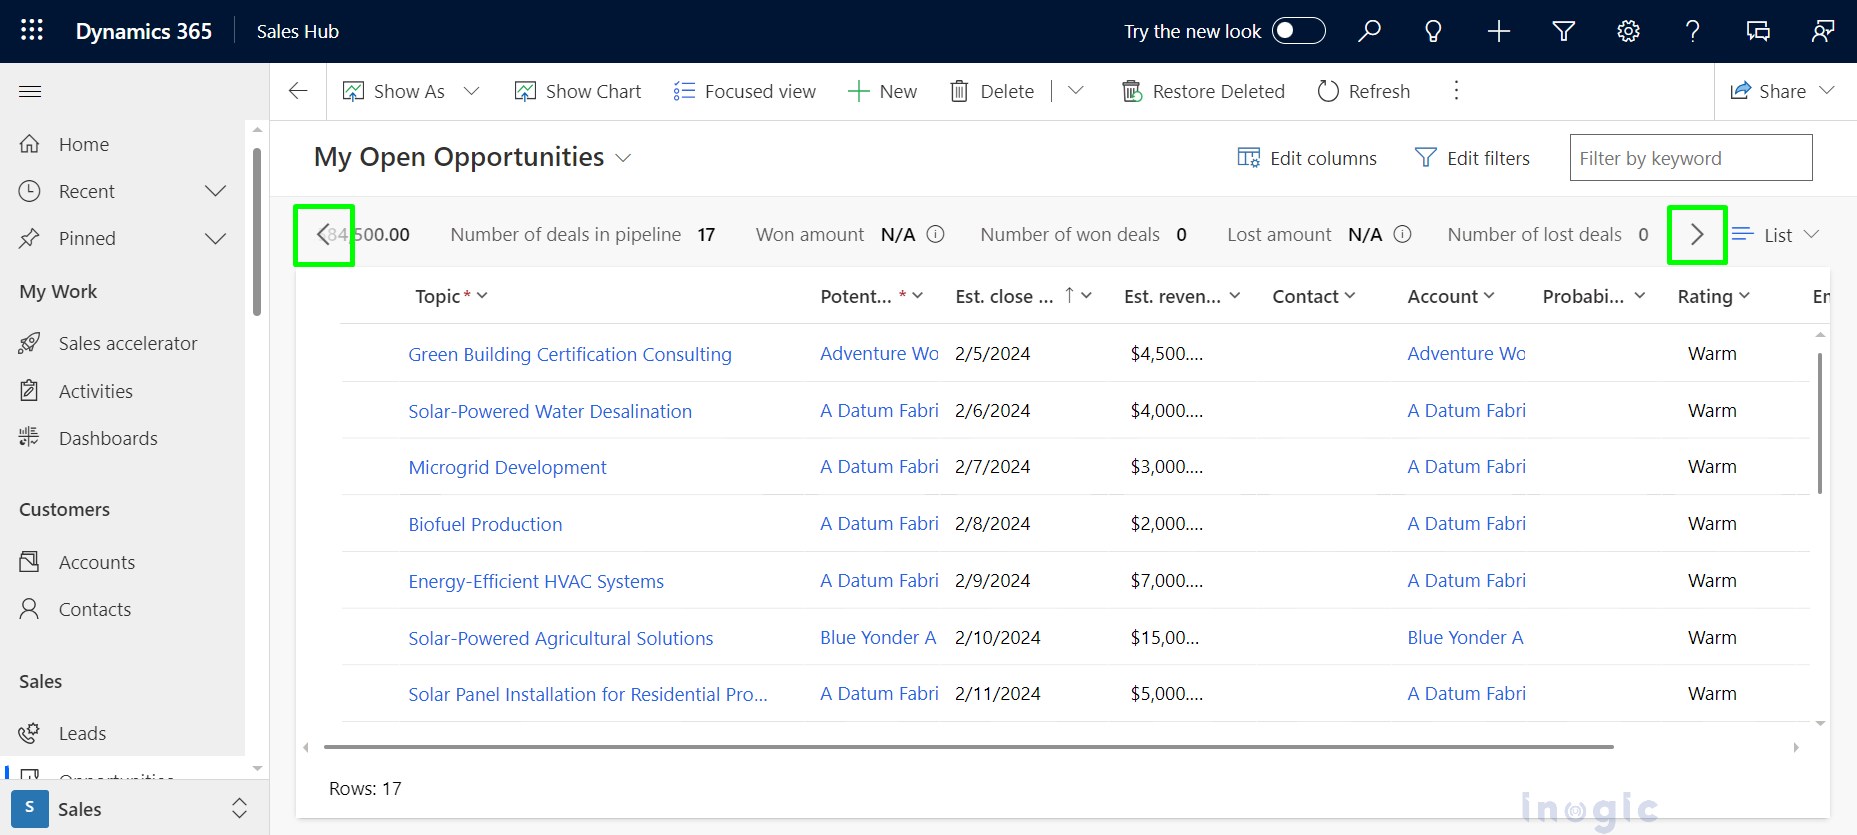
You can modify this information as per your requirement from the editable grid as described below.
- Navigate to the List button and then click on the Edit metrics button as shown in the screenshot.
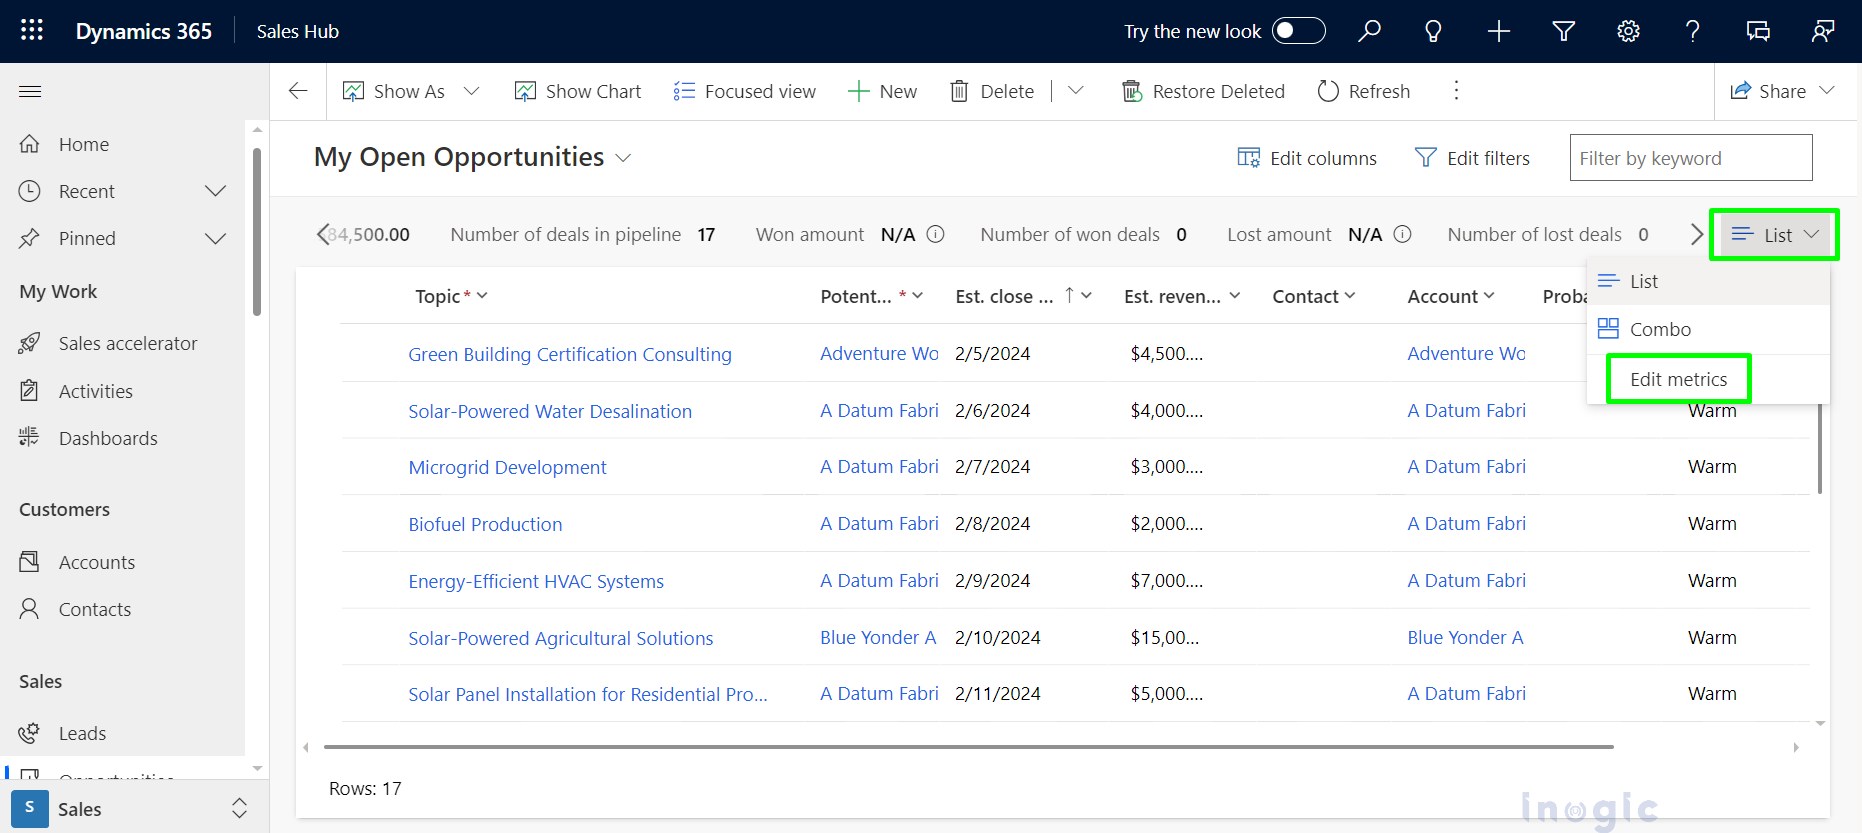
- After clicking on the ‘Edit Metrics’ button, the highlighted area below will open.
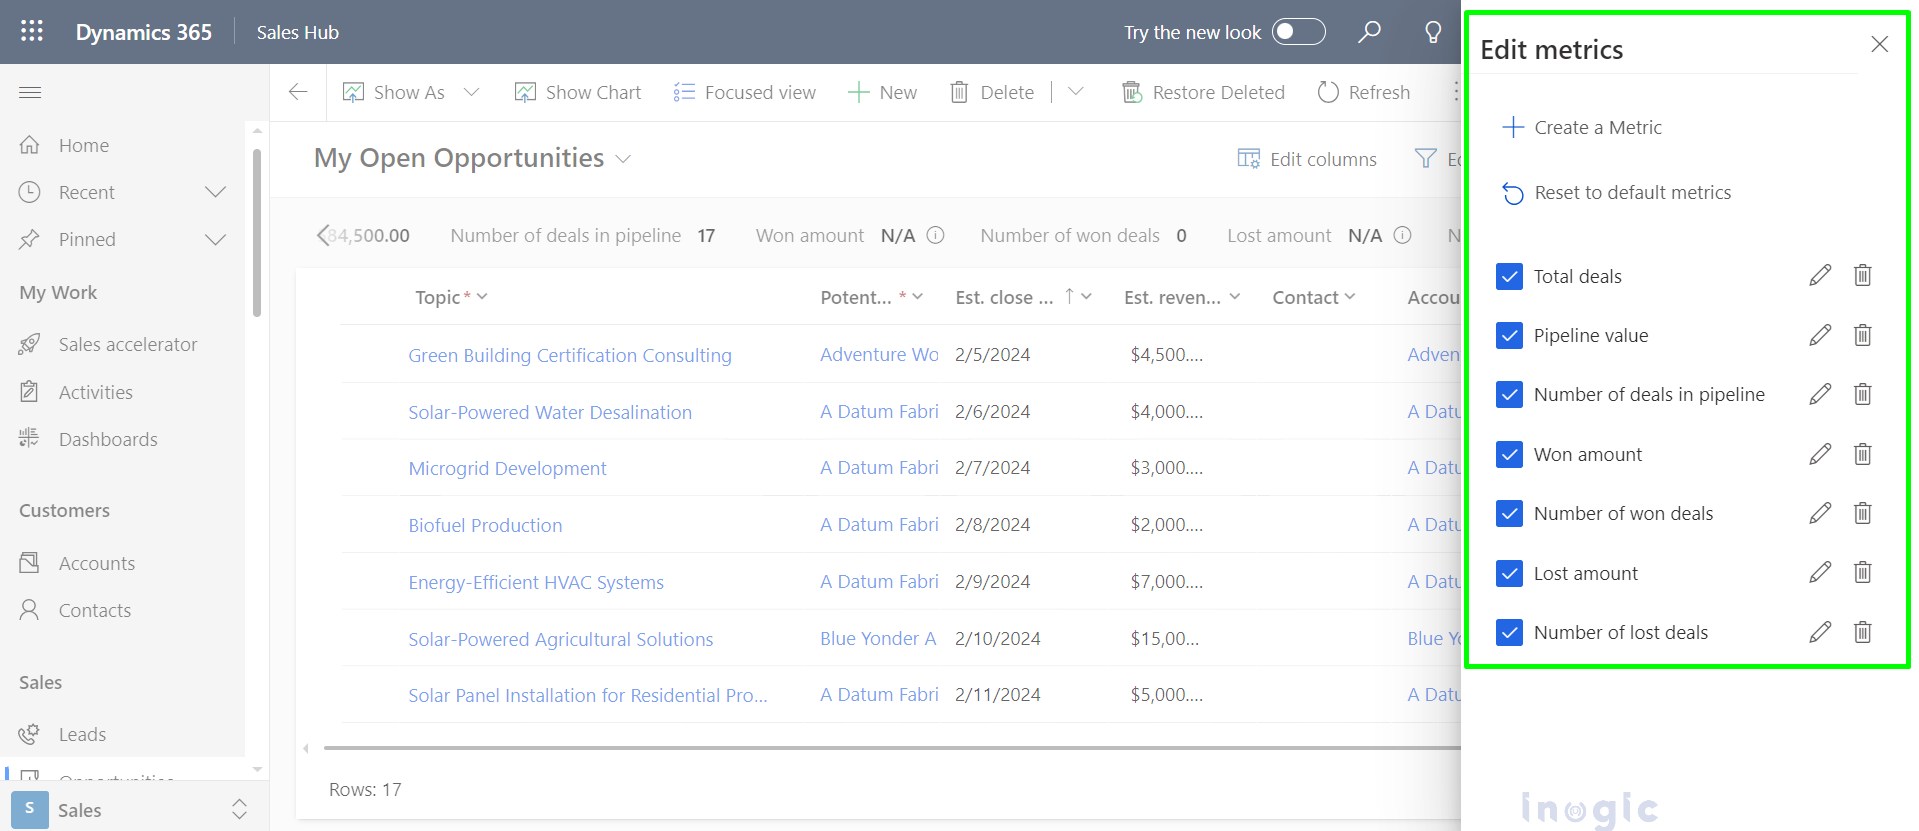
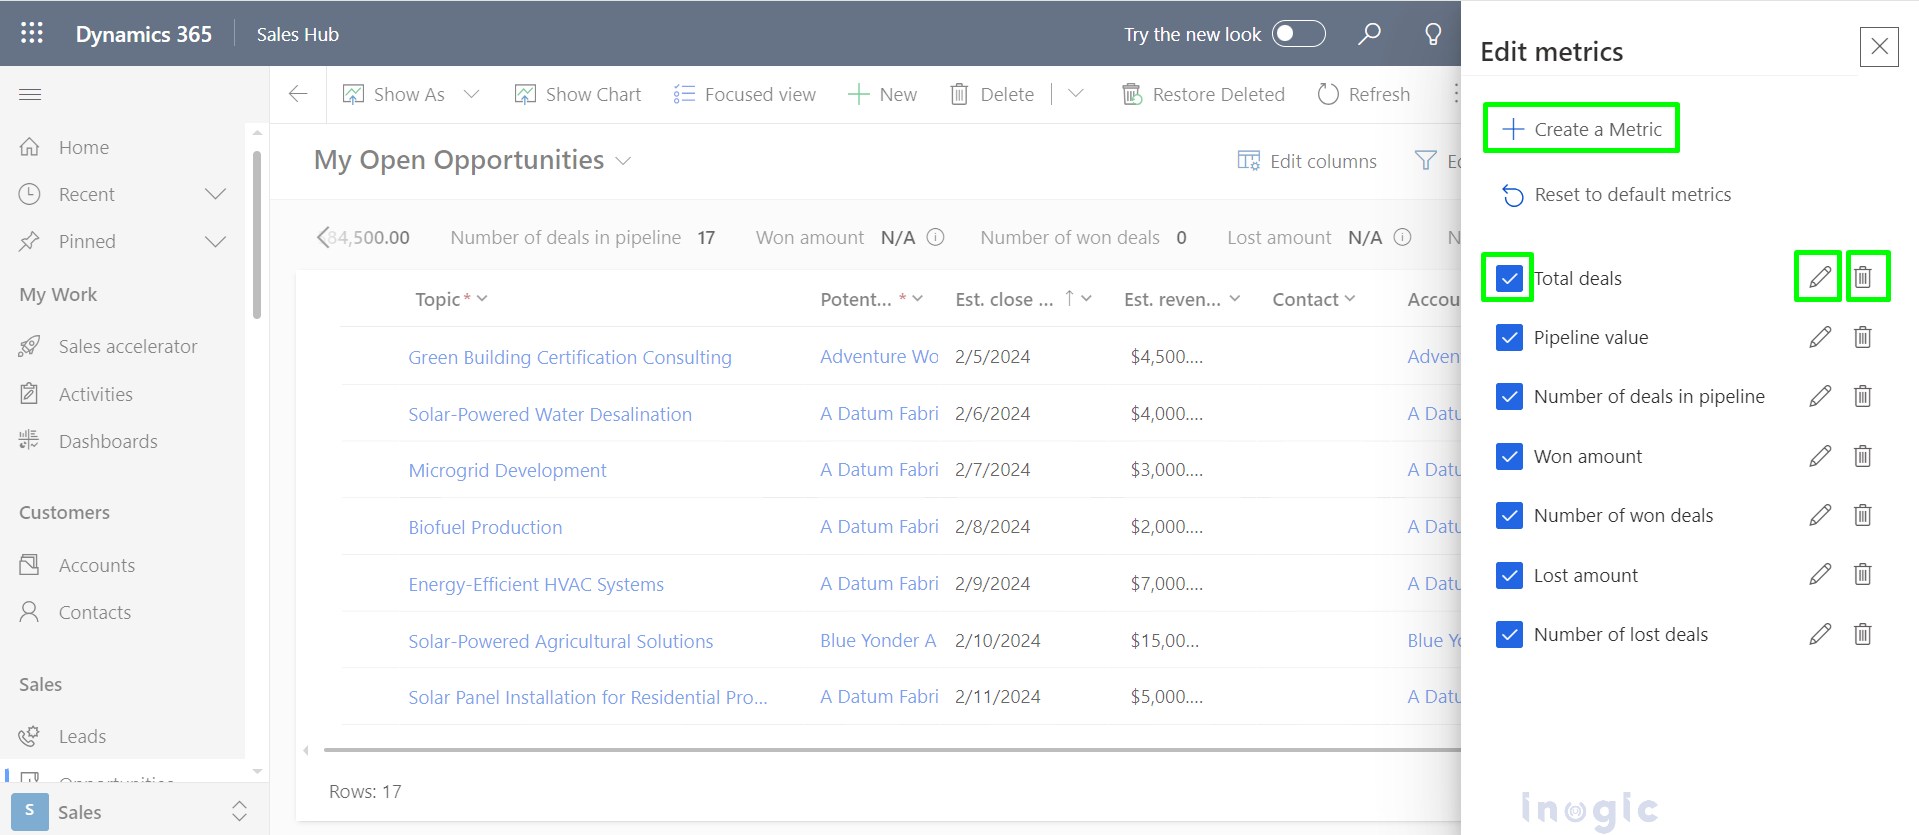
- From here you can create, edit, remove, and delete Metric fields as per your requirement. So, to create a new Metric field → click on the Create Metric button, for Editing existing Metric → click on the Edit icon, and remove the existing Metric → untick the Checkbox, to delete the existing Metric → click on the Delete icon, as shown in below screenshot.
Here we remove all default created Metric fields by clicking on the delete button and further will set new required metric fields as per our Business use case.
As per the Business use case here we calculate the Estimated Revenue generated from Multinational client Contoso Electronics and Local client A Datum Fabrication.
- Click on the Create metric button.
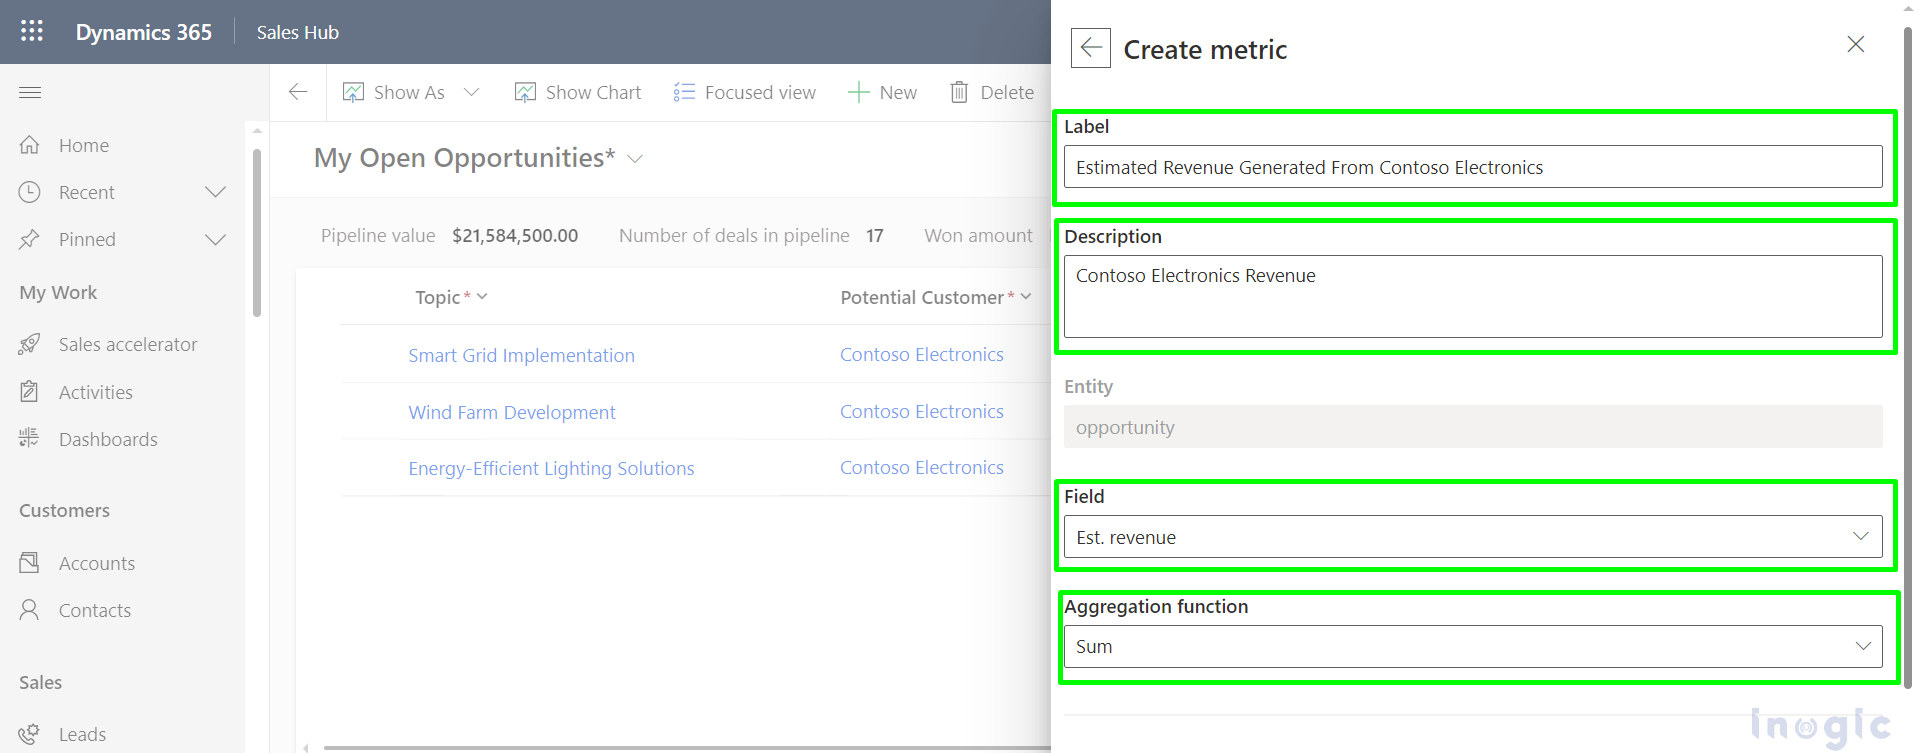
Then the form below will open, here fill in all required details as explained below.
- Label – Provide an appropriate label name.
- Description – Describe label name.
- Entity – Opportunity entity gets auto-populated.
- Field – Click on the dropdown arrow and choose the required field for the aggregate function.
- Aggregation Function – Click on the dropdown arrow and choose the required functions such as Average, Sum, Min, Max, and Count.

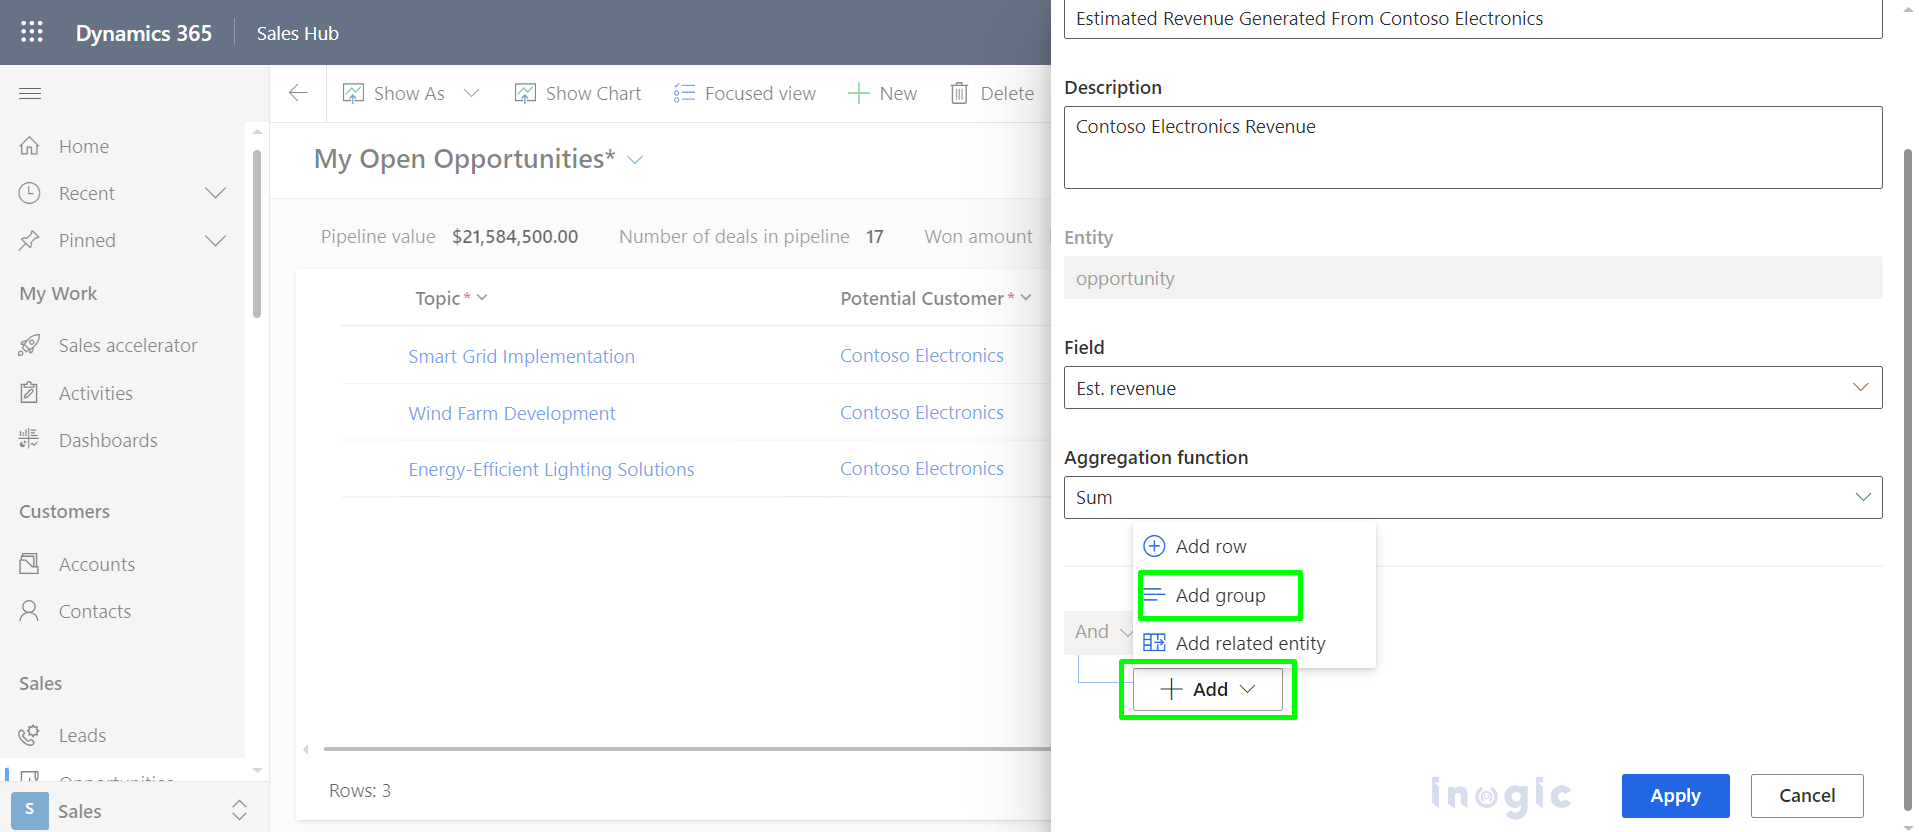
- Scroll Down and click on the Add button and then on Add Group Button.

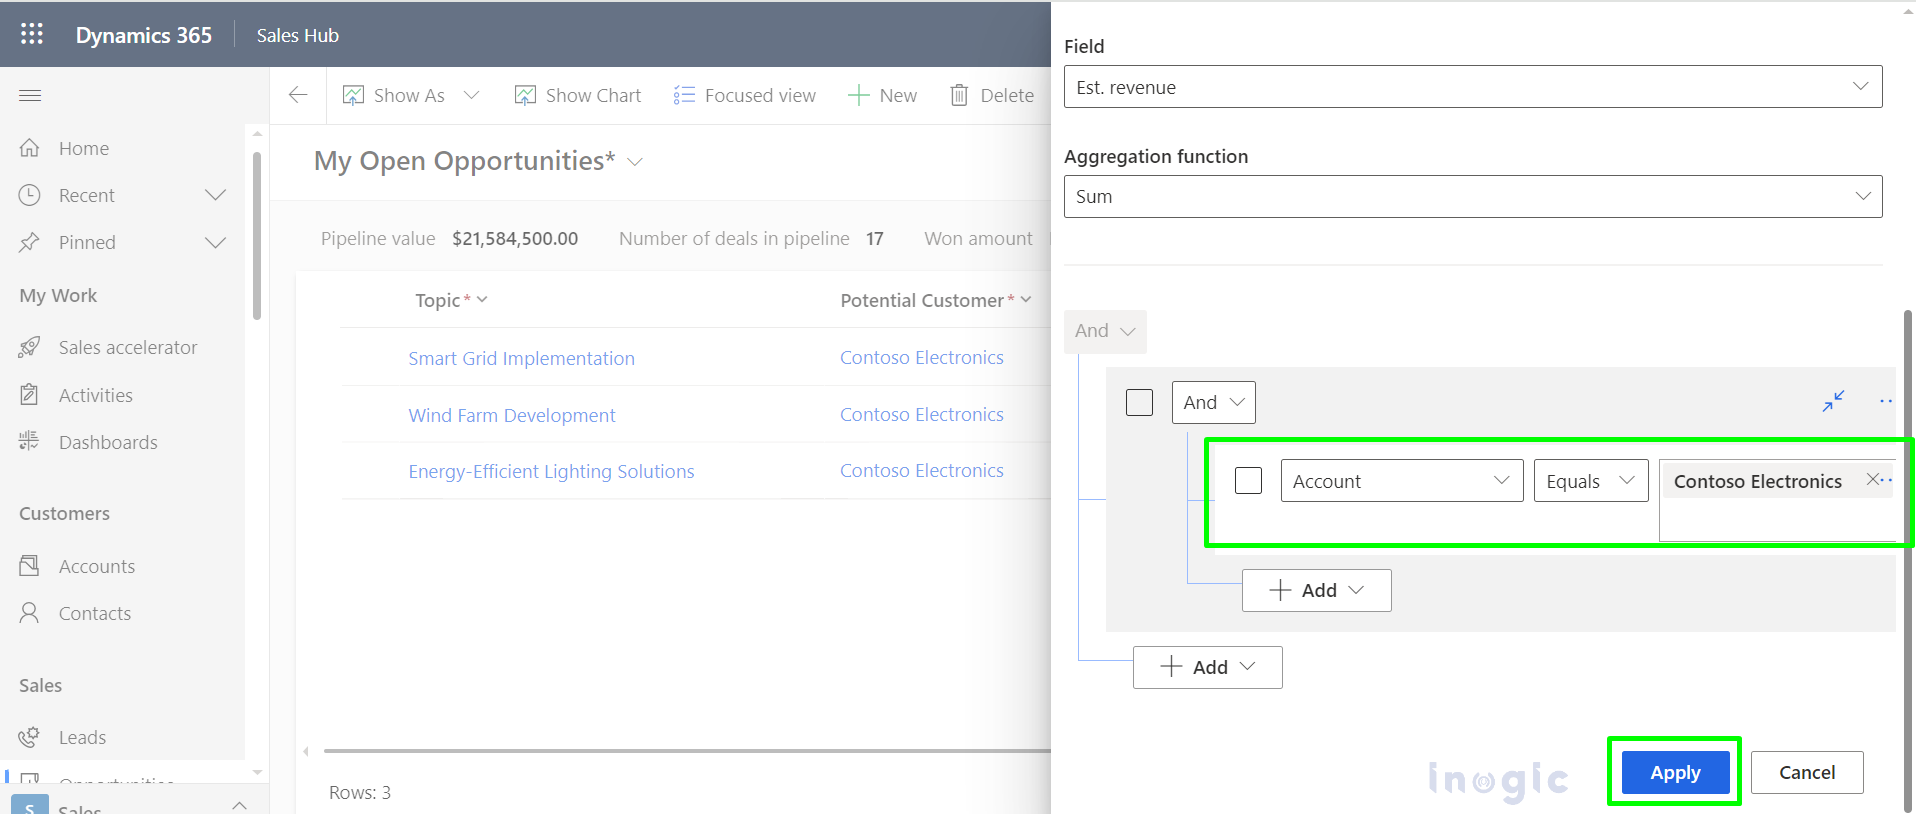
- After Clicking on the Add Group button Below highlighted window will open. Select Account Equals Contoso Electronics and then click on Apply

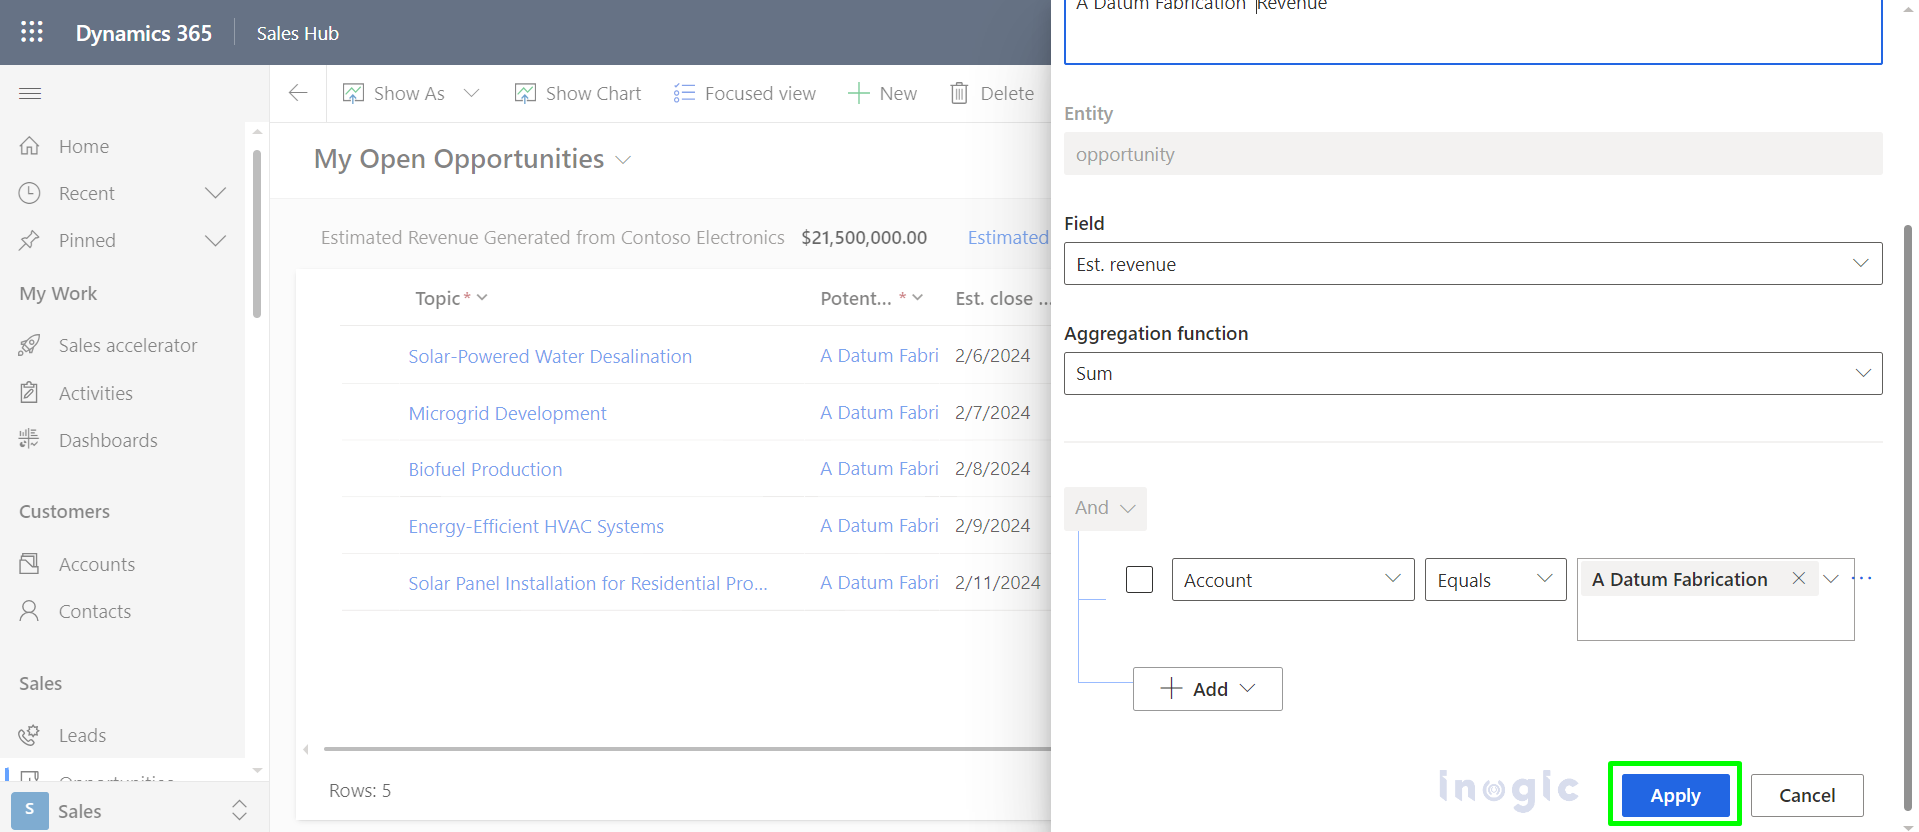
- Similarly, configure for Estimated revenue generated from A Datum Fabrication as shown below.
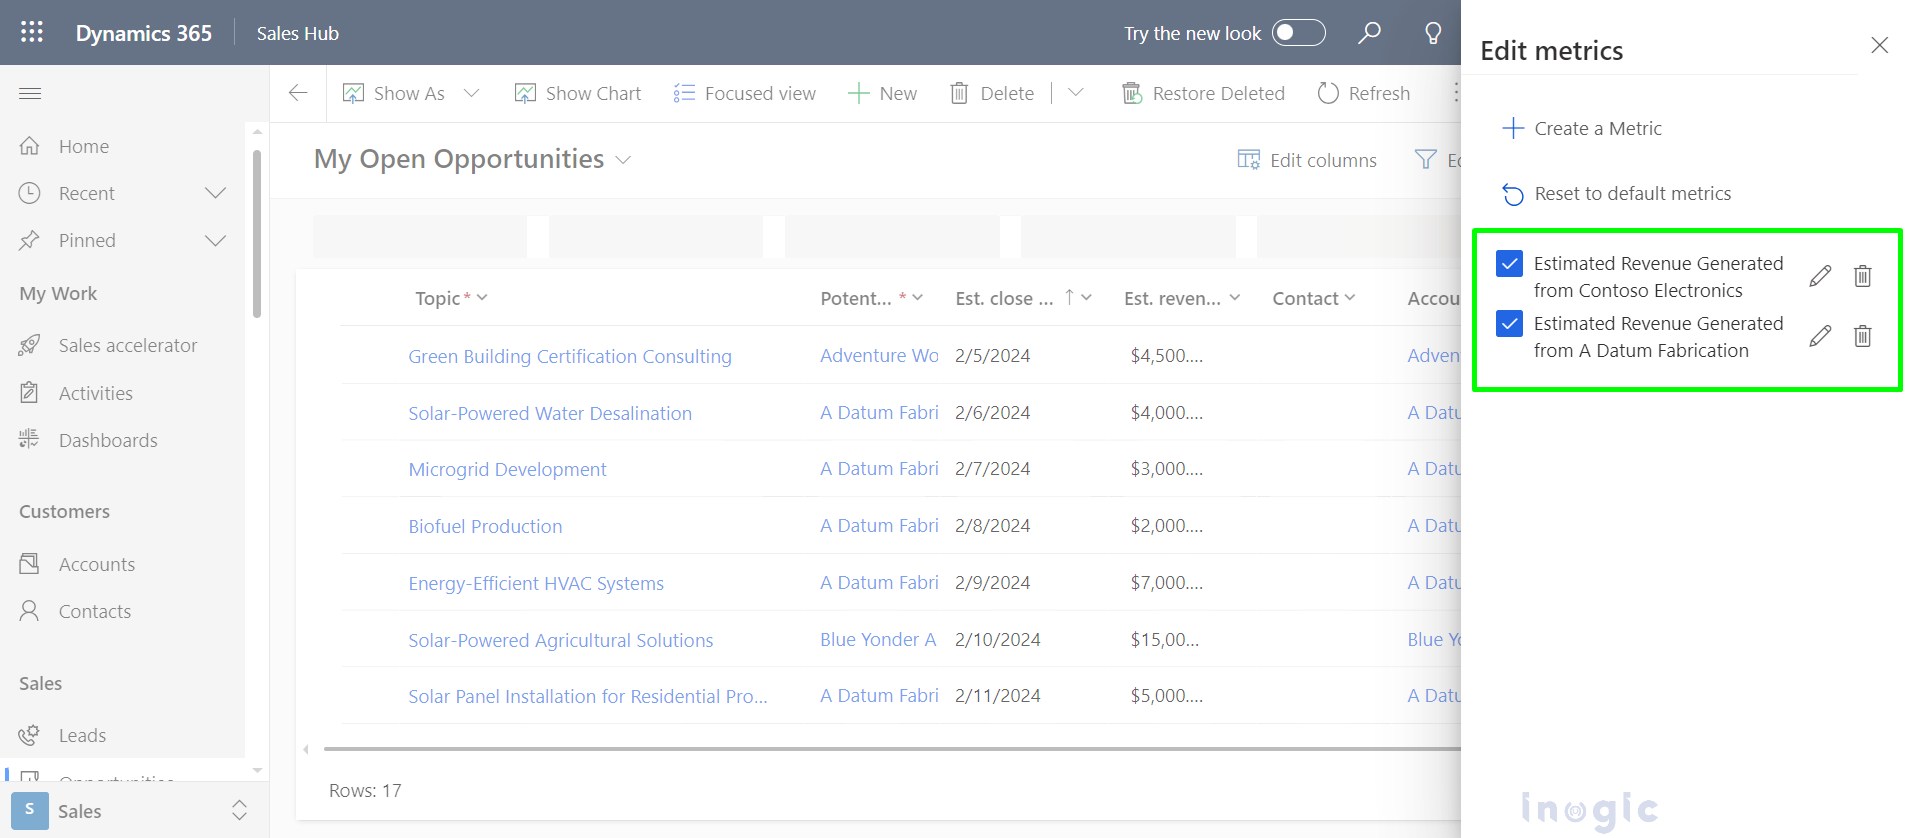
- After clicking on the Apply button created metric field will be displayed as shown below.

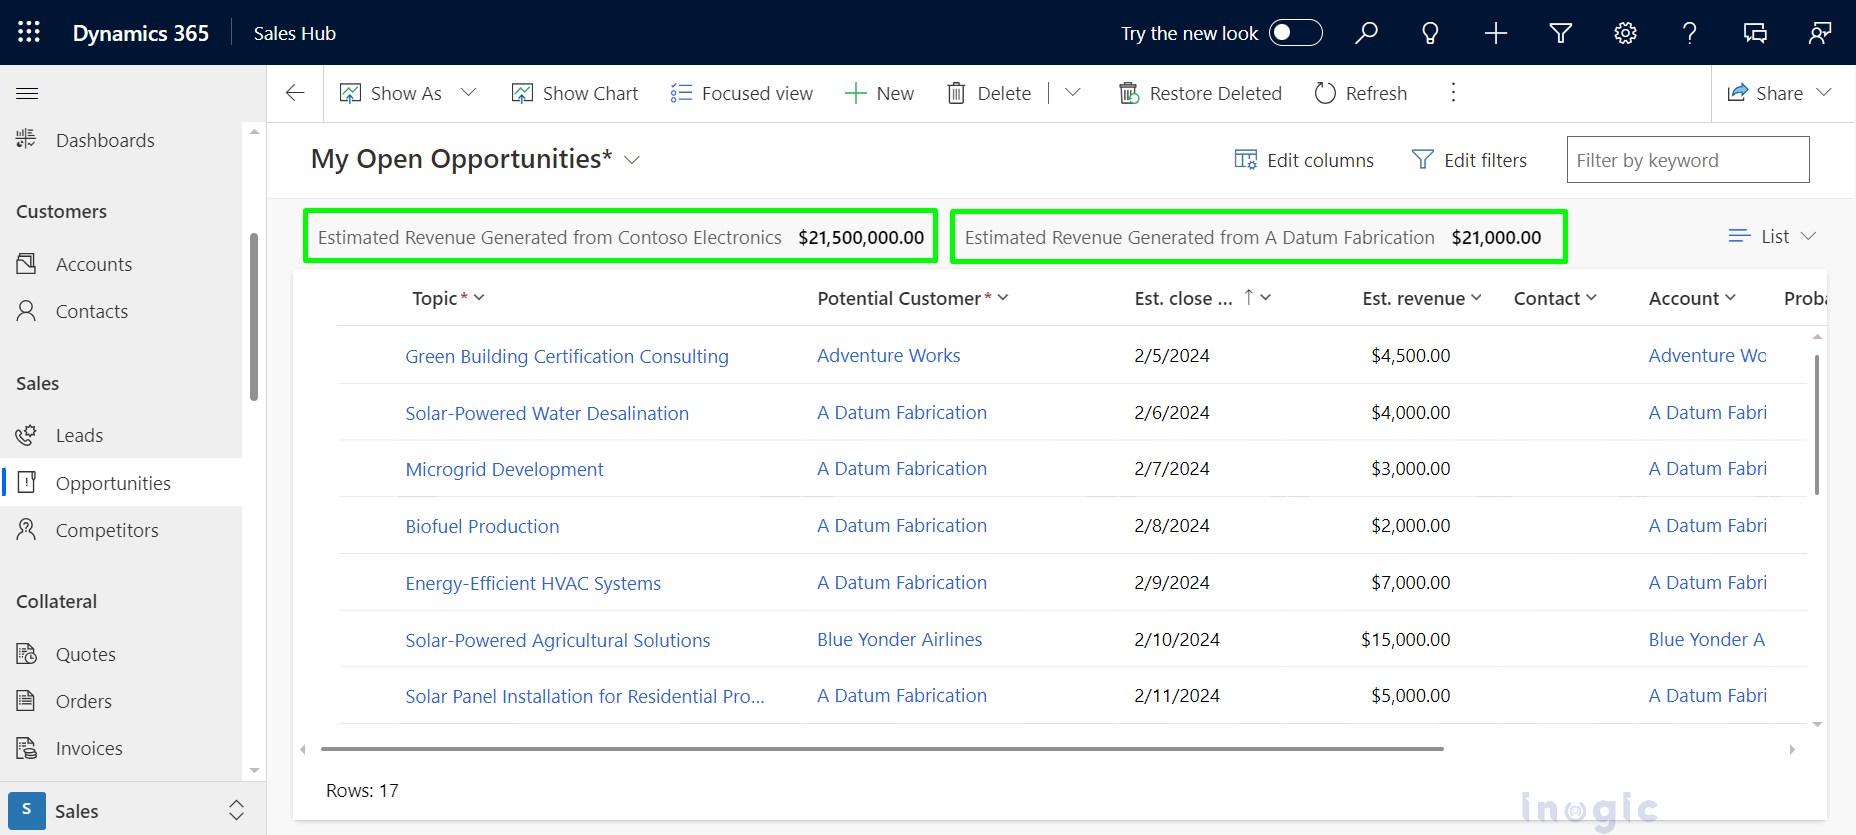
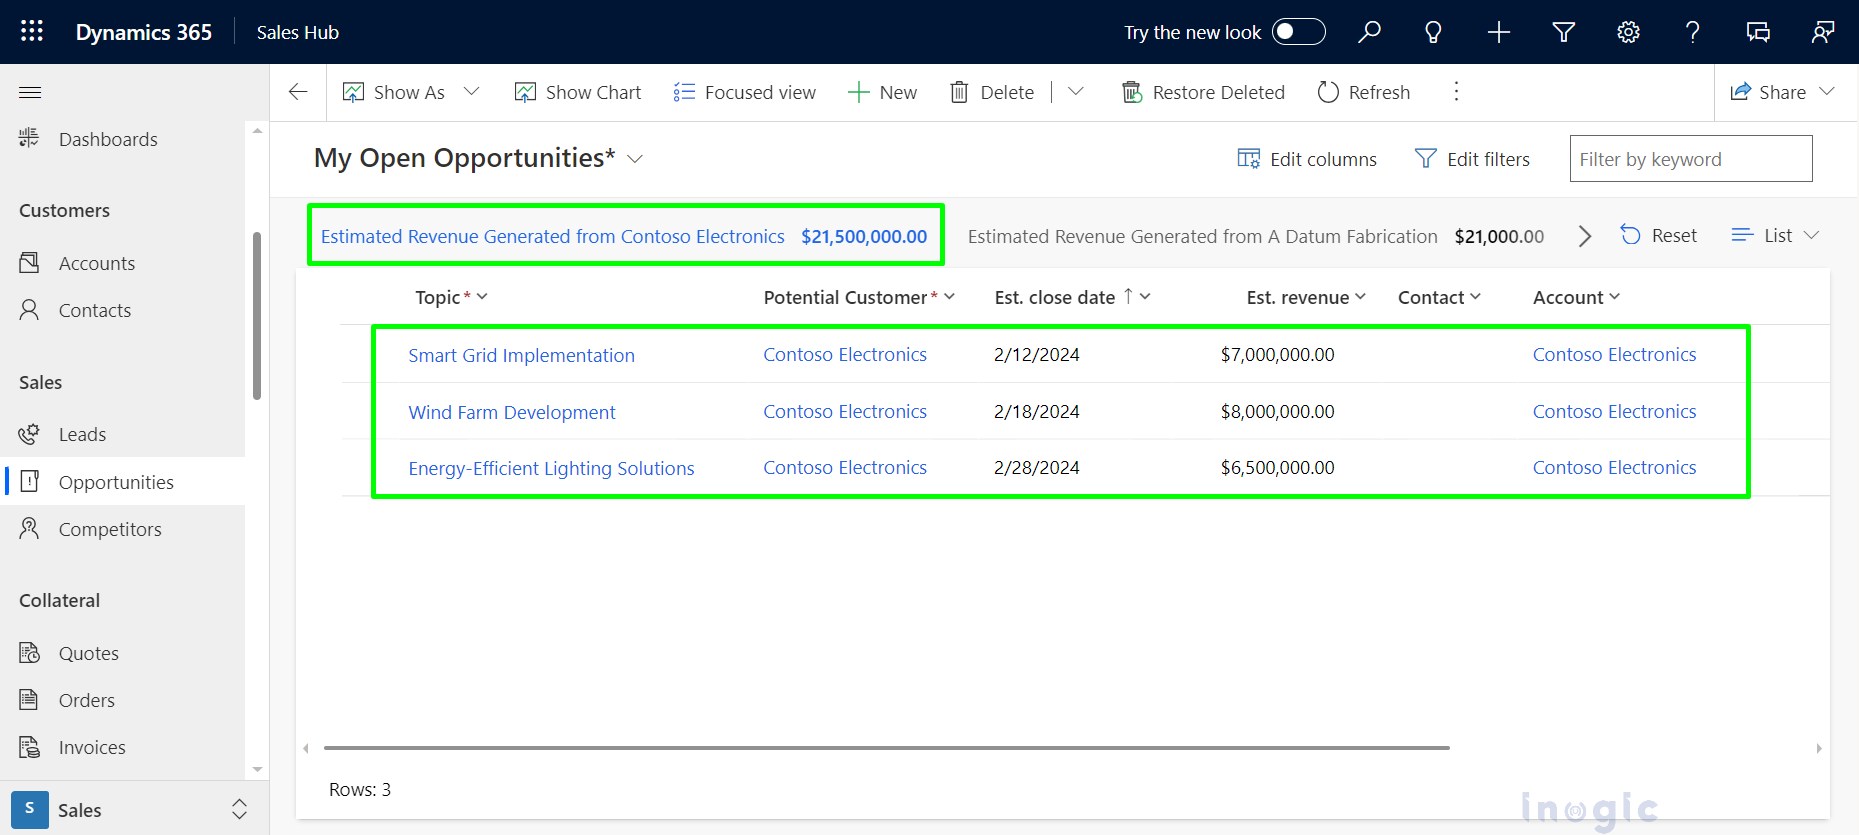
- The two Metric fields created above will be shown on the Information bar as seen in the below screenshot.

However, users can see the opportunities of Contoso Electronics in the group by clicking on Estimated Revenue Generated from Contoso Electronics as shown in the below screenshot.
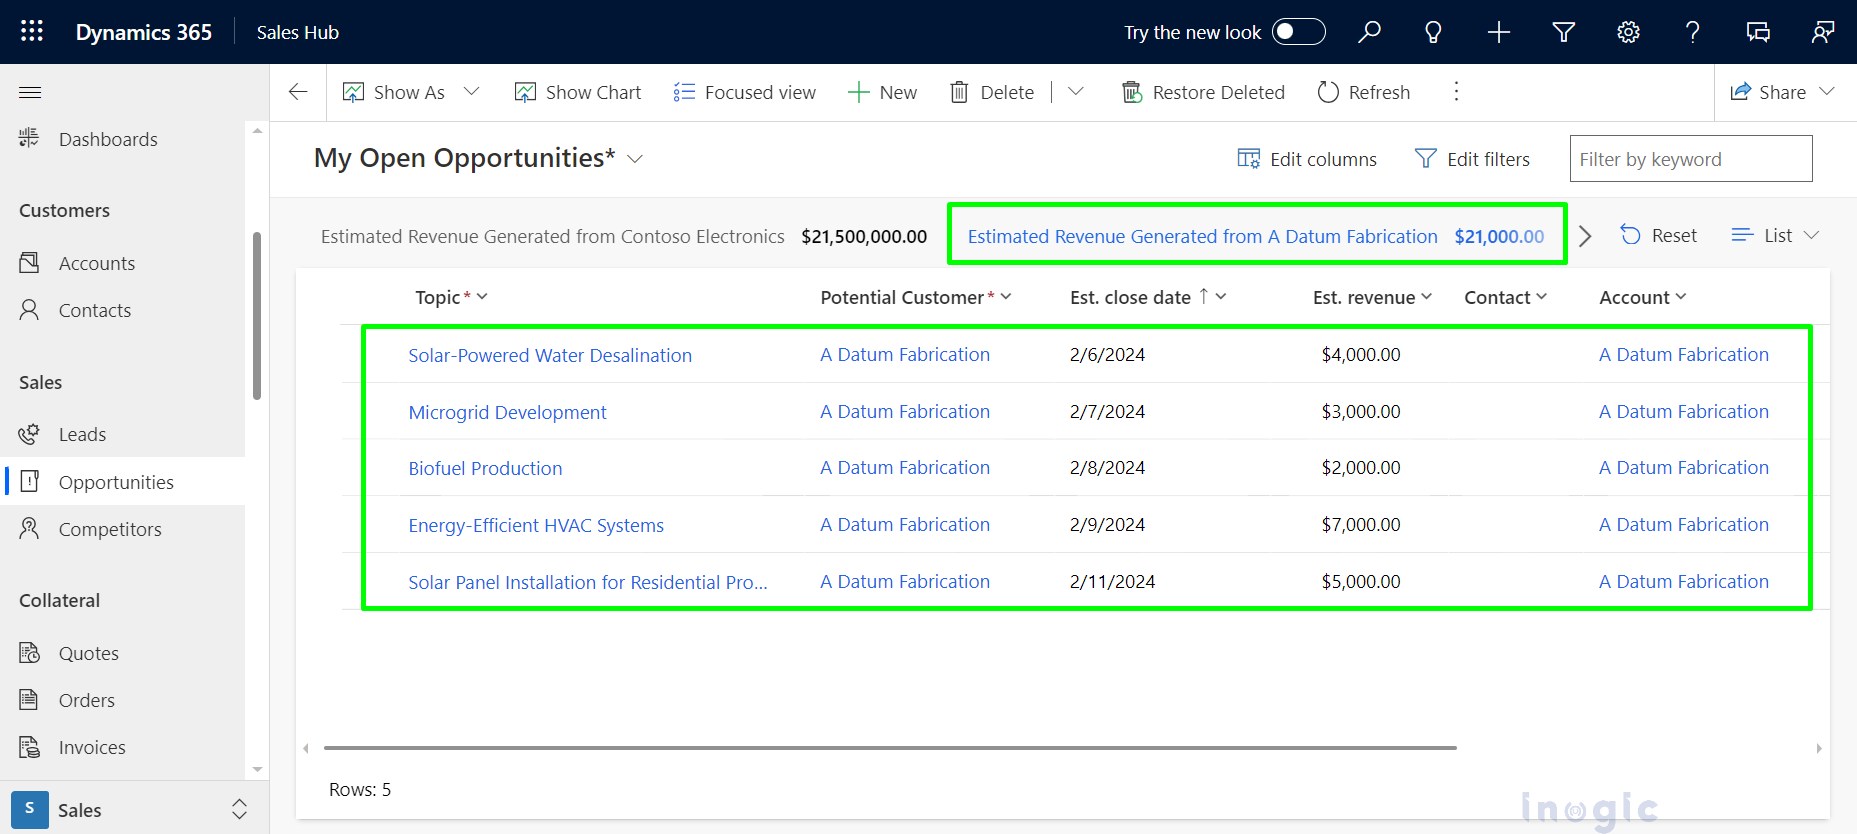
Similarly, users can also see the opportunities of A Datum Fabrication in a group by clicking on Estimated Revenue Generated from A Datum Fabrication as seen below.
Conclusion
This helps with a strategic focus on the opportunities that earn significantly more profits for the organization. It provides a quick overview of financial data on the dashboard, allowing for optimized resource allocation and informed decision-making for maximum financial impact to the organization.