Microsoft has provided an analytical tool Power BI, which allows us to display our organization data in the form of dashboards to give us a high-level insight into the data. Power BI Desktop application provides the below-listed features to build the reports.
- Paginated Reports: Provide the ability to develop the reports that are available for download by users.
- Reports: Provide the ability to create interactive reports with an easy and effective insight into your data.
- Scoreboard: This allows us to develop a dashboard to keep track of the Task Status within an organization.
- Dashboard: Multiple reports can be displayed on the dashboard to provide collective insight into the data for the Data Analyst.
- Dataflow: Provide the ability to process the data and have the required data, which is essential for visualization.
- Streaming Dataset: This allows us to work with real-time data generated from API, Azure API, etc.
We all use SQL Server Reporting Tool (SSRS) to develop the reports within Visual Studio in order to display the data on the report, Power BI also provides us extensibility to have the same user experience and features to develop the Paginated Reports with Power BI Report Builder. We can connect to various sources by creating connections to them and can create a dataset by using SQL Queries to get the data for specific DataSource.
In this blog, we will walk through how we can build Paginated Reports with Power BI Report Builder. These reports can be shared or exported as PDF, Excel, and other formats as well.
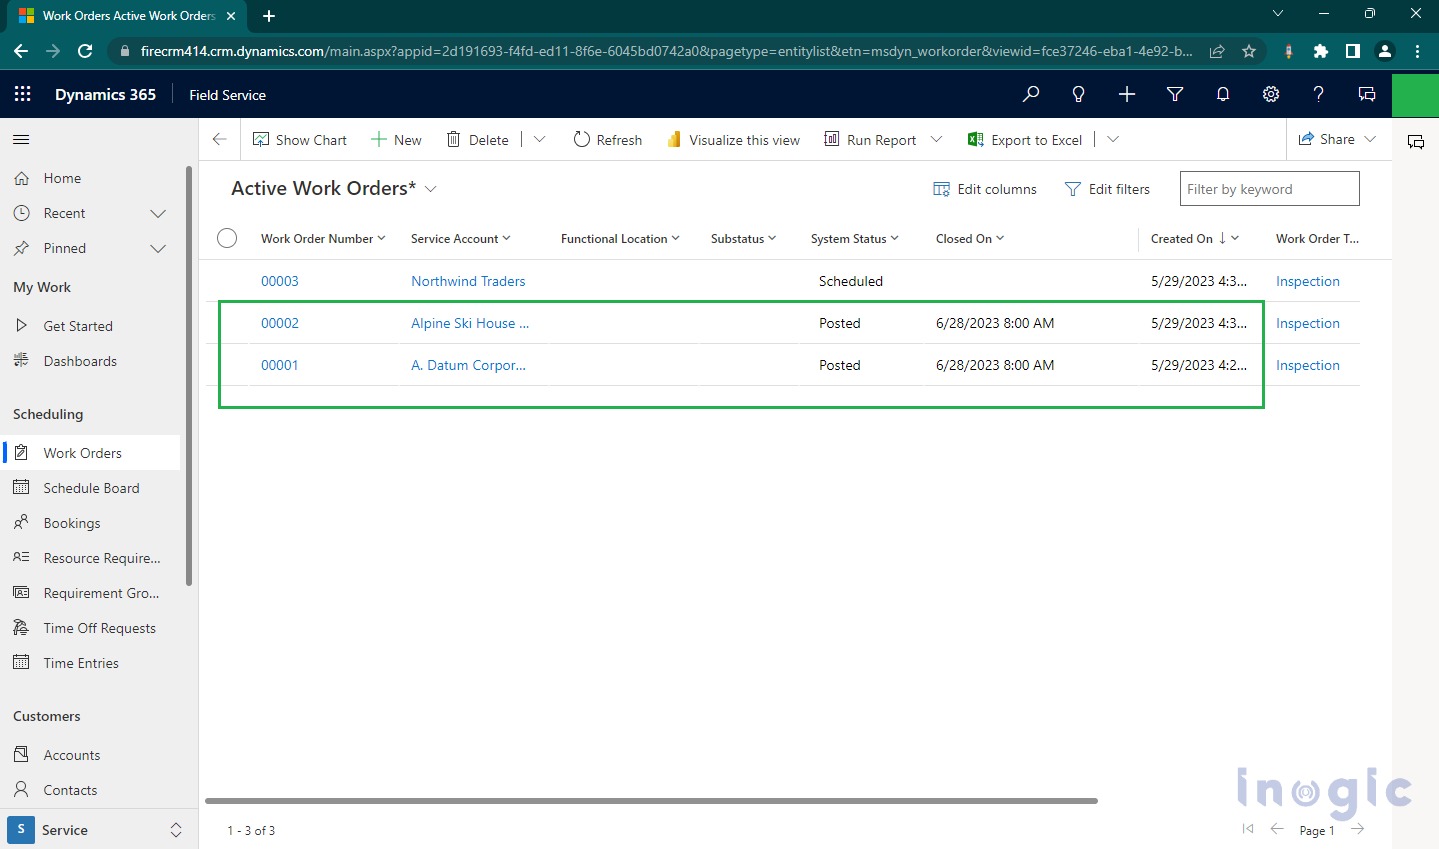
- For example, Field Service agents perform the asset inspection at the Customer Location and fill in the Questionnaires based on the task they perform onsite. Field Service Administrators have to generate the report for today’s Posted Work Orders based on the System Status of the Work Order as “Posted” and Posted Date as today.
We need to follow below steps to develop the report within Power BI Report Builder.
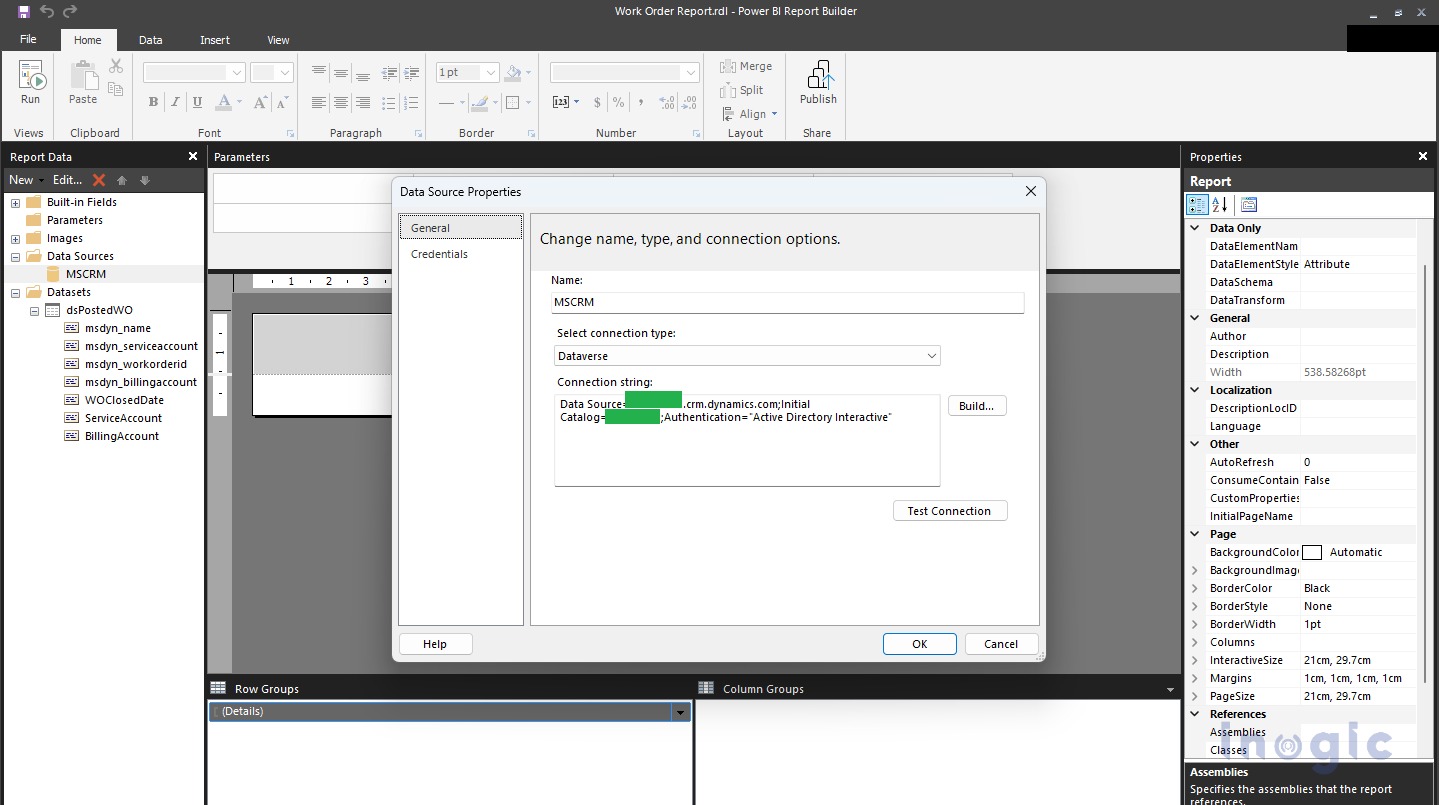
Step 1: Open Power BI Report Builder and create a new report with the name “Work Order Report”. As we are working with Work Order data from Dynamics 365 CRM, we need to create a Data Source for Work Order entity.
Please see the screenshot below for the same.
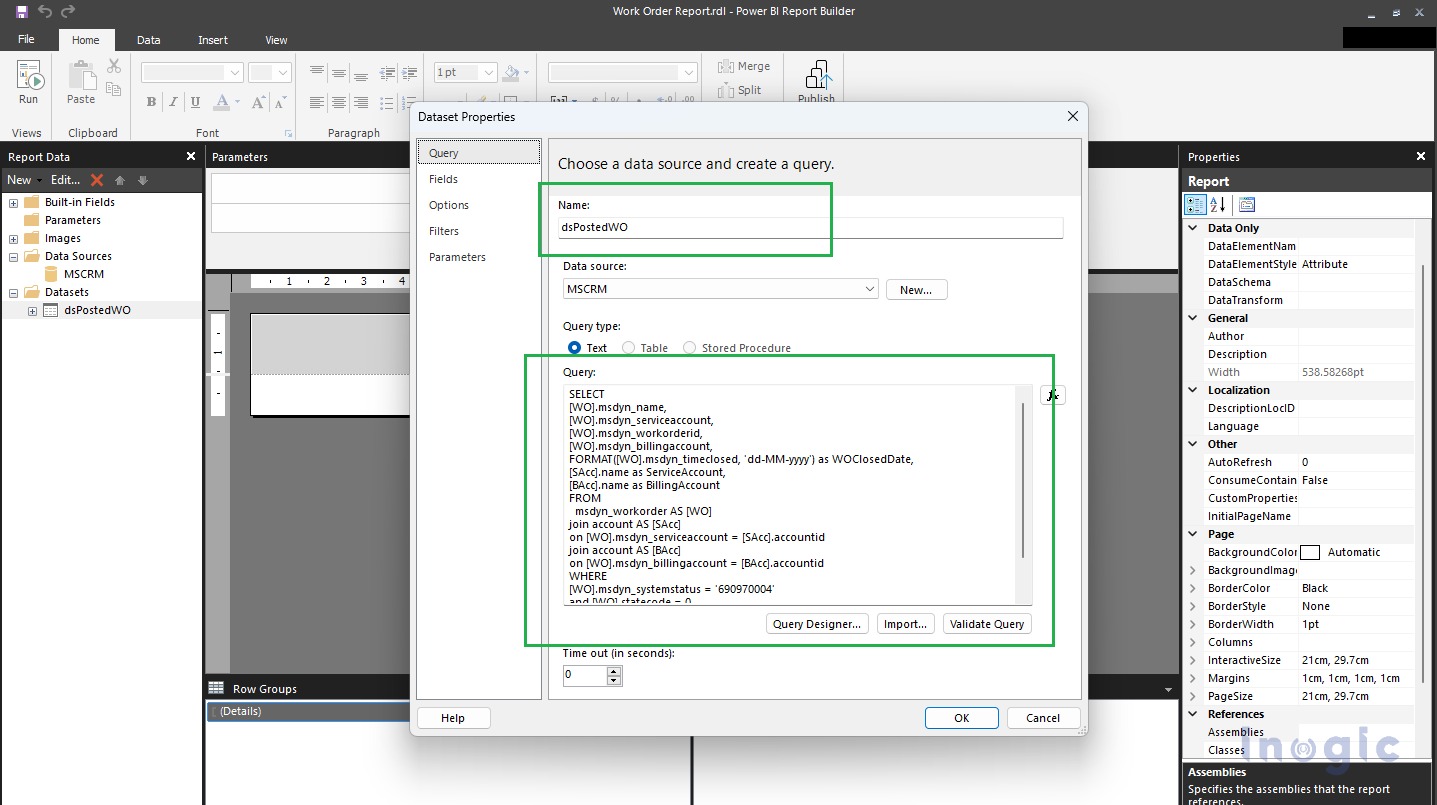
Step 2: Once we establish the connection with Dataverse, we will create a Dataset with a SQL query for the Work Order entity, as shown below.
Step 3: Now we require same format of data to be displayed per page for each Work Order that is Posted by technicians today. So, we will add a sub-report to iterate for each Posted Work Order and display respective details on individual pages one by one.
So, we will first develop a new report named Work Order Sub Report. Note that we need to follow the same steps as above to create a data source. Then create a dataset to get the additional information related to the Work order, as below. As this report will take the parameter (Work Order ID) from Main report, we need to add the below query.
SELECT
[WO].msdyn_name, [WO].msdyn_serviceaccount, [WO].msdyn_workorderid, [WO].new_customersign, [WO].msdyn_billingaccount,FORMAT([WO].msdyn_timeclosed, ‘dd-MM-yyyy’) as WOClosedDate,
FORMAT([WO].msdyn_completedon, ‘dd-MM-yyyy’) as WOCompletedDate,
WHERE
[WO].msdyn_workorderid = @WOId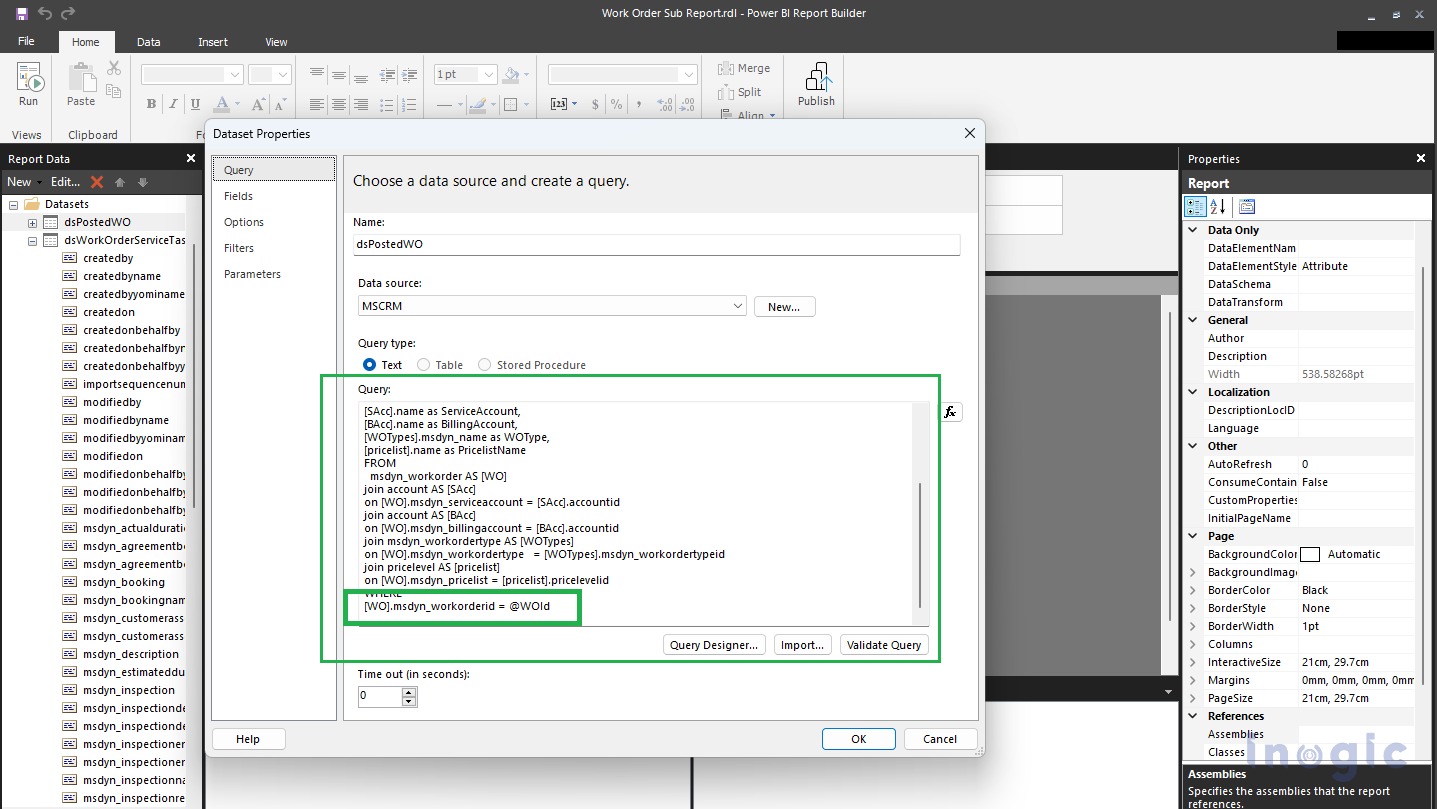
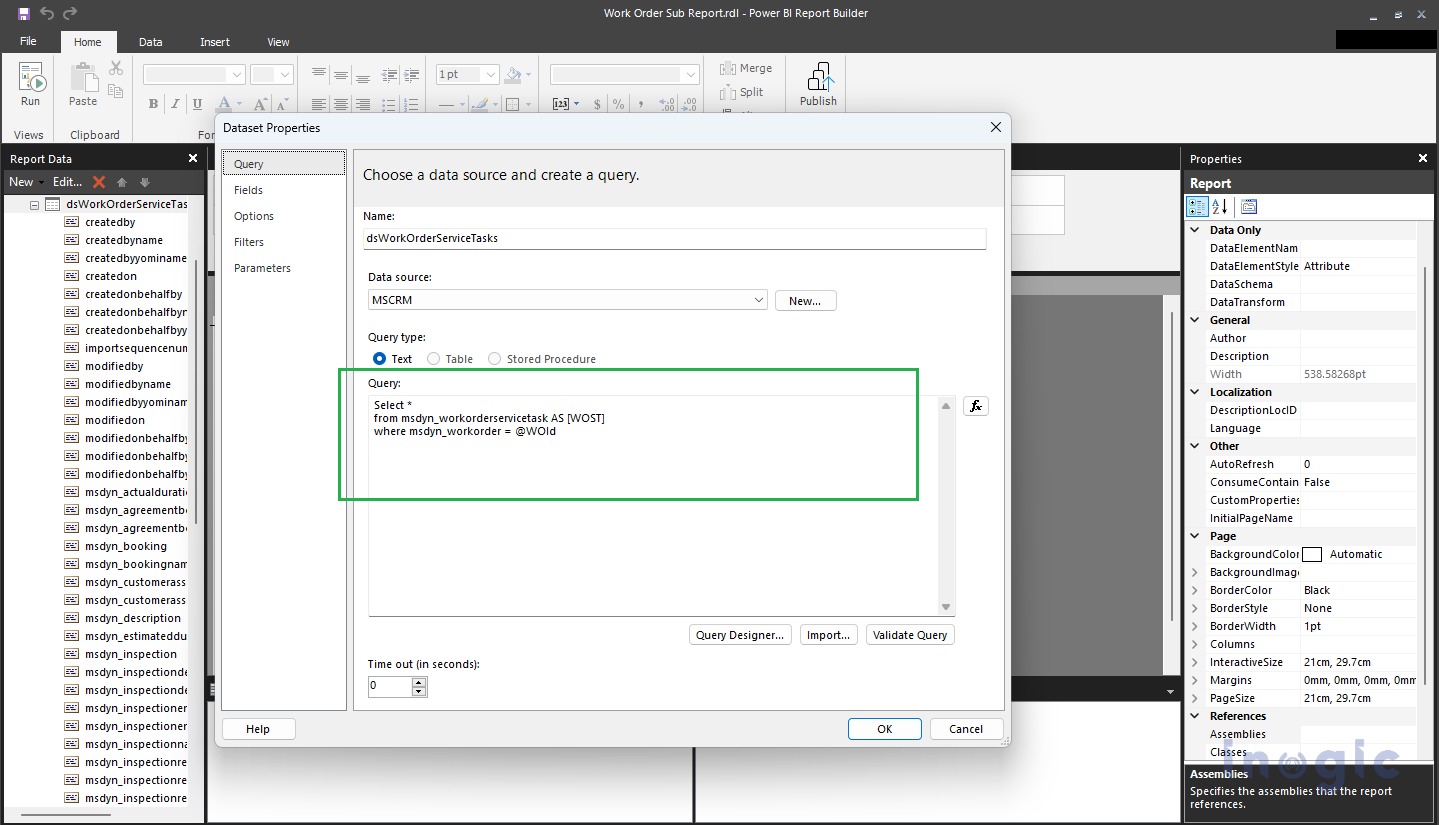
Step 4: We need to display inspection tasks performed by the technician at customer location so we need to get the Work Order Service Tasks related to the Work Order with below query.
Select *
from msdyn_workorderservicetask AS [WOST]
where msdyn_workorder = @WOId
This will generate the WOId parameter automatically in the sub report, which will be used when we add a sub report to the main report so that for each Work Order, same sub report will iterate and display respective data.

Step 5: We can develop the report with various Visuals such as Table, Matrix, Image, Gauge Panel, and so on. We have developed a sample Work Order report with below visuals.
- Textbox: Display the title as Work Order Report.
- Table: Display work order details as WO #, WO Posted Date, WO Completed Date, Service Account, Billing Account, WO Type, and Price list.
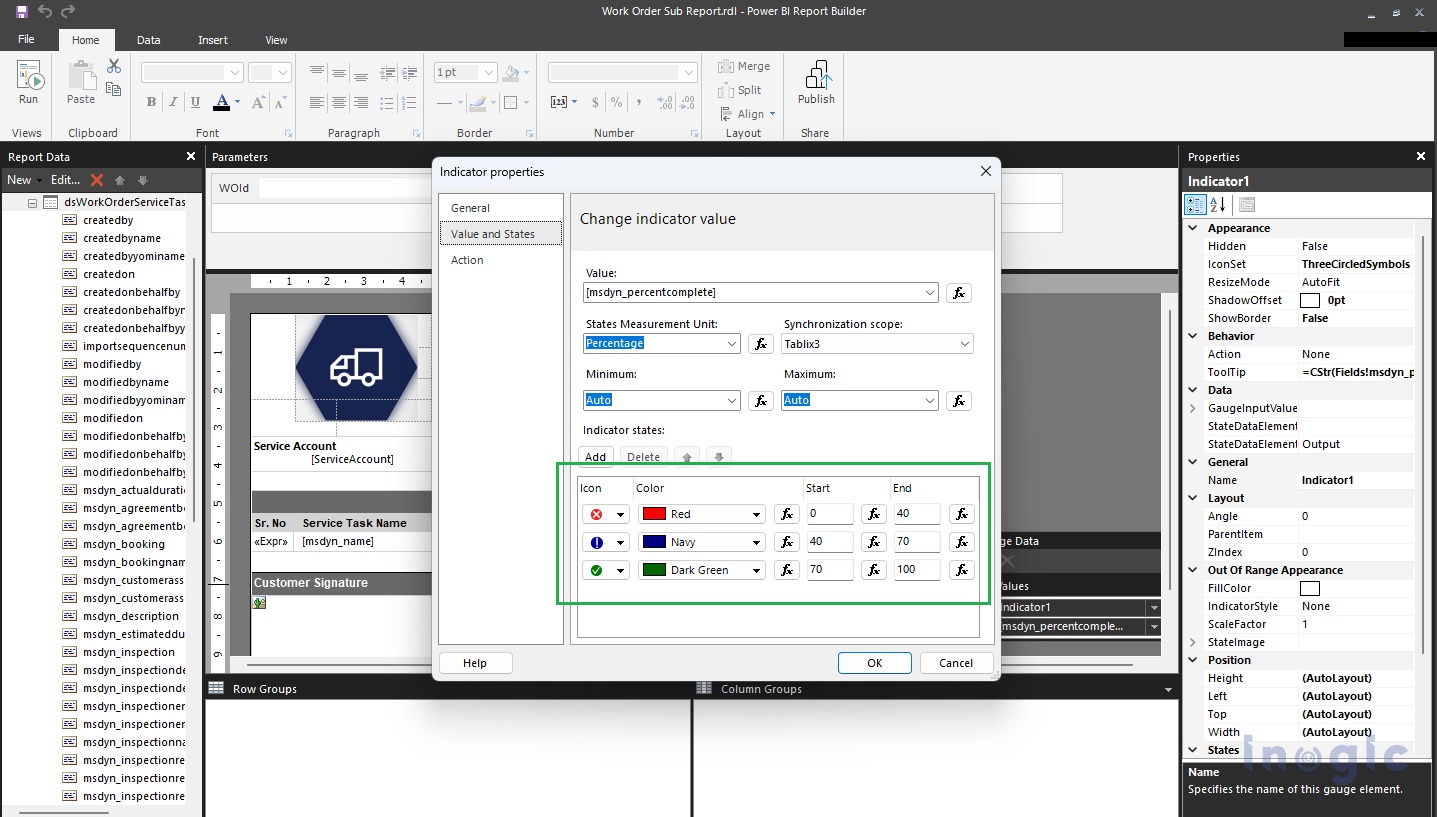
- Gauge Panel: Added Table to display Work Order Service Tasks Inspection with list of Work Order Service Tasks with Sr. No., Service Task Name, Estimated Duration. Also, we have added a Gauge Panel that will display different icons based on “Percentage Complete” field data of each Work Order Service Task. Please refer to the below screenshot to check how to set the icons based on values in the Gauge Panel.
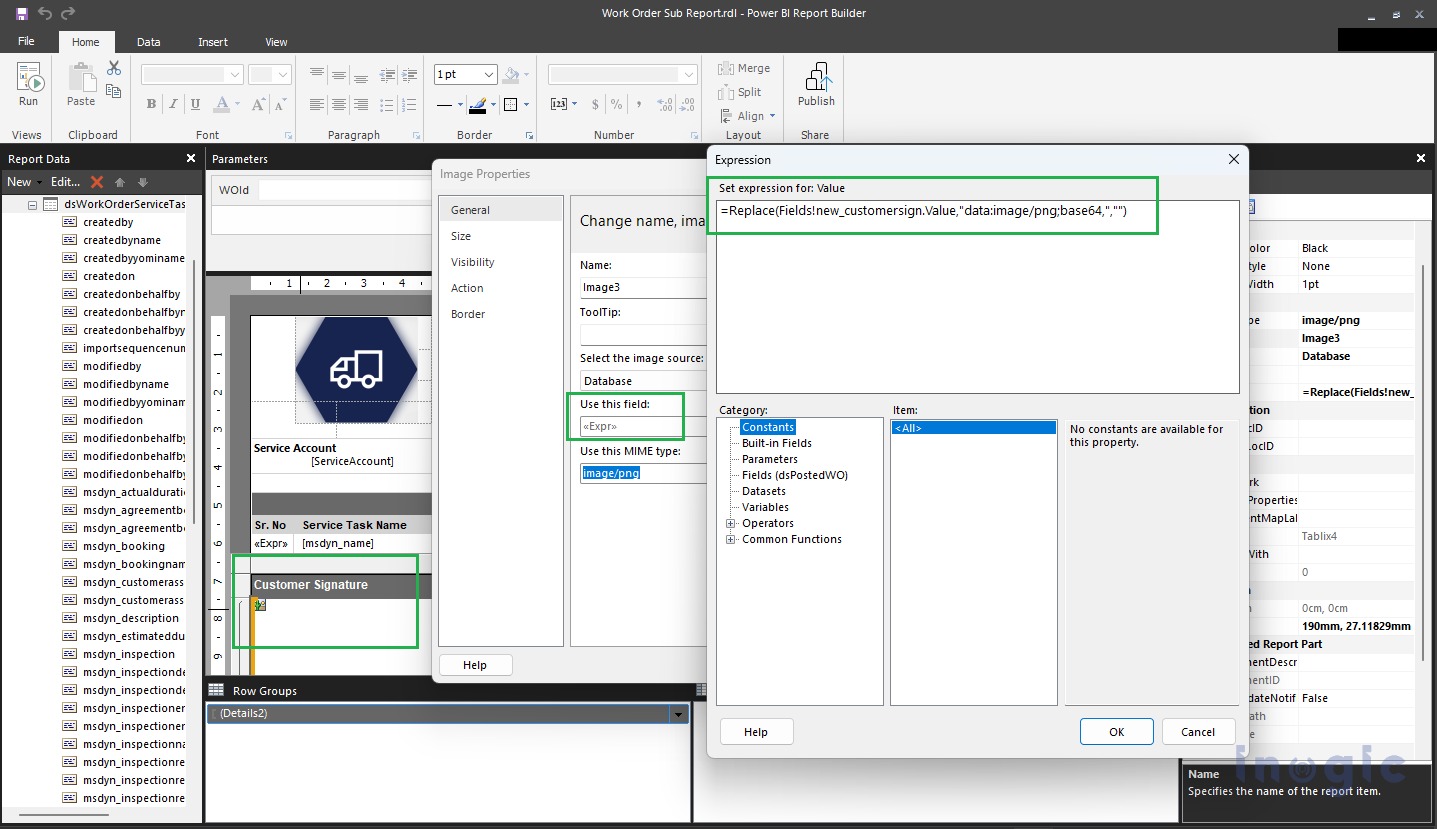
- Image: Added an image control where the Customer’s Signature will be displayed. Note that we have created a custom field to capture the signature using Pen Control.
Please refer to the below screenshot for mapping the image control properties on the report.
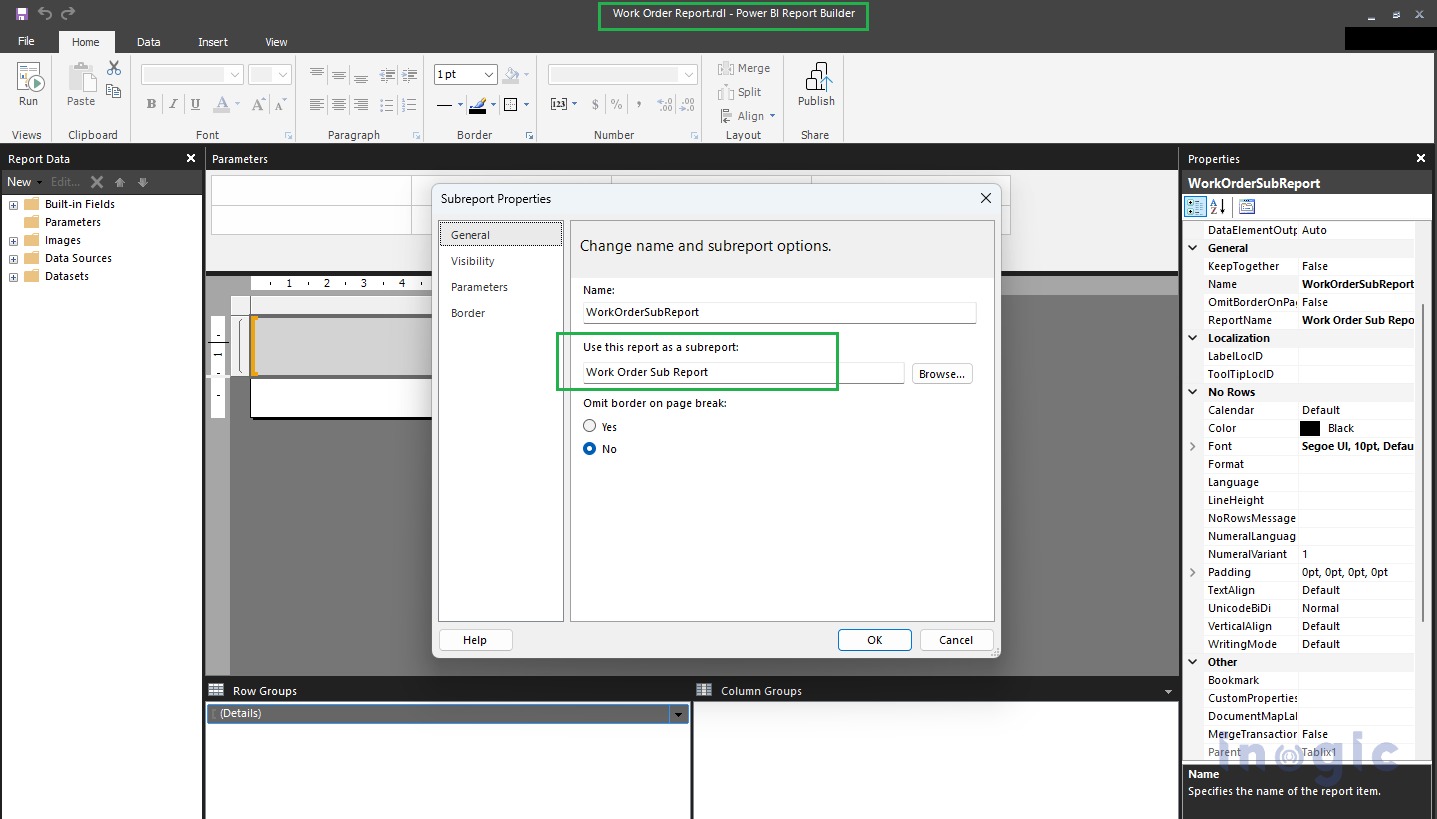
Step 6: Now we are ready to use this report on Main report, so for each Work Order, same report will be used. Navigate back to the Work Order Report in the Power BI Report Builder. Add a List control and add Sub report control in the same with “Work Order Sub Report” as shown in the below screenshot.
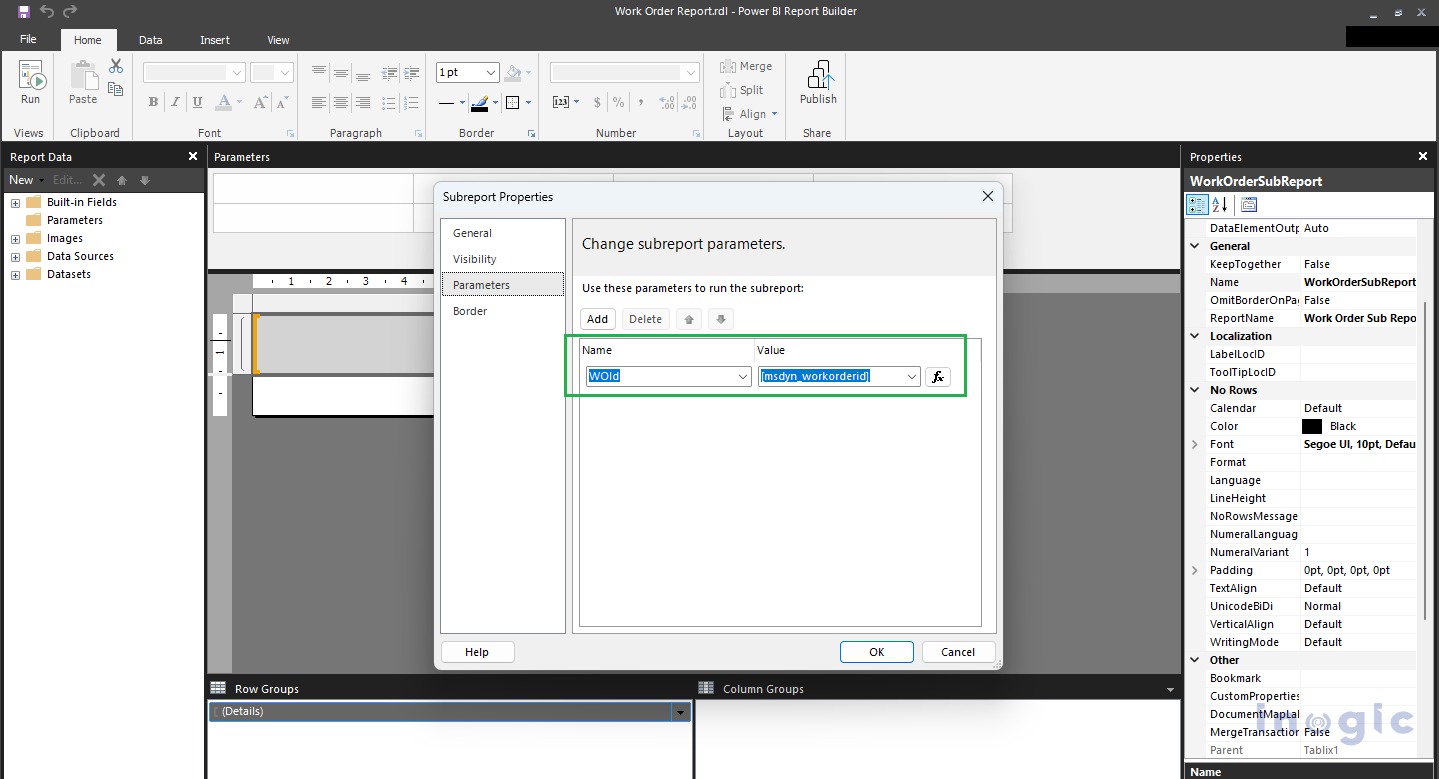
Step 7: Set the parameter to the Sub report as shown in below screenshot for the same.
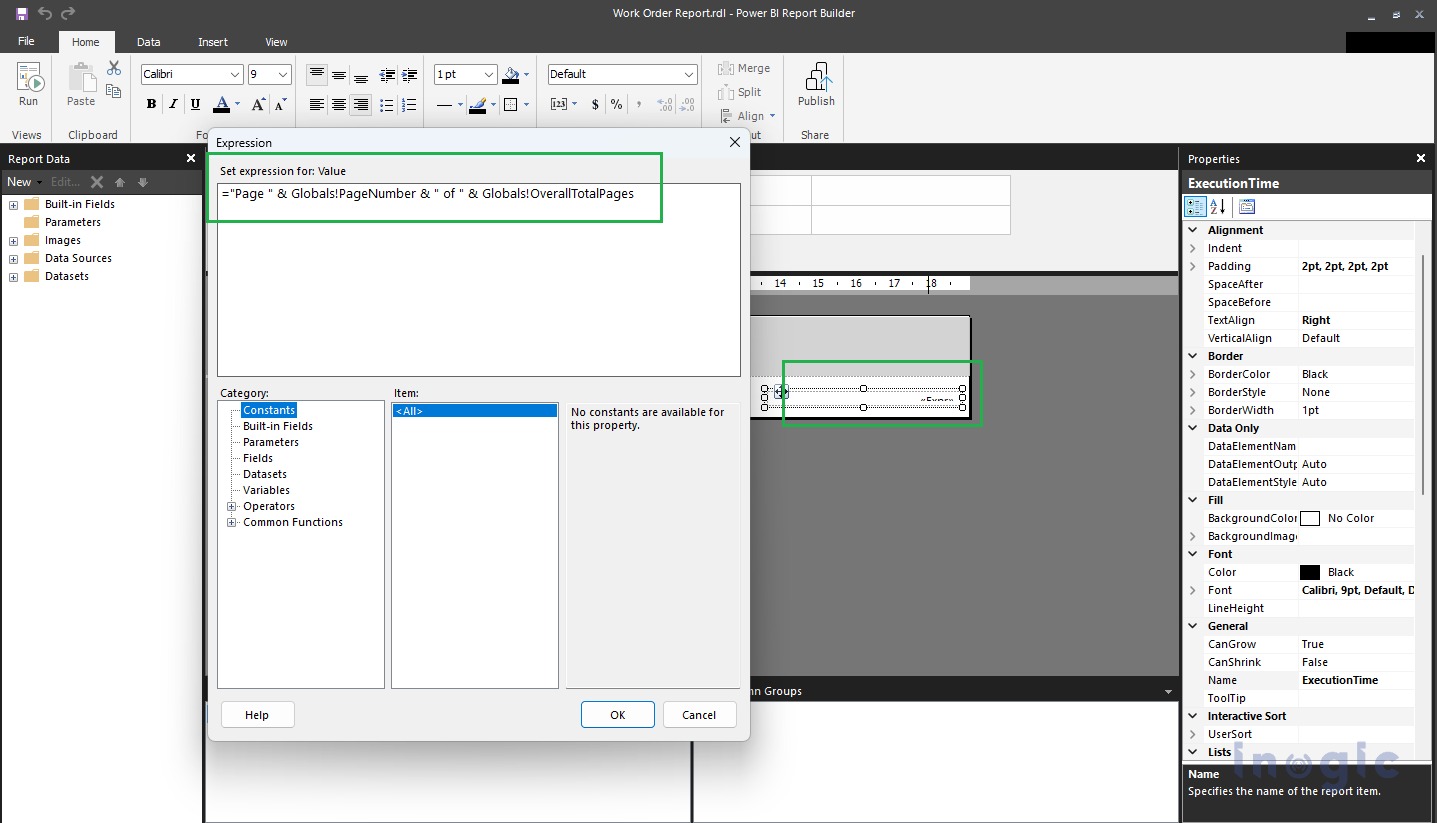
Step 8: Added the footer to the report where page number will be displayed using below expression within the textbox control.
=”Page ” & Globals!PageNumber & ” of ” & Globals!OverallTotalPages
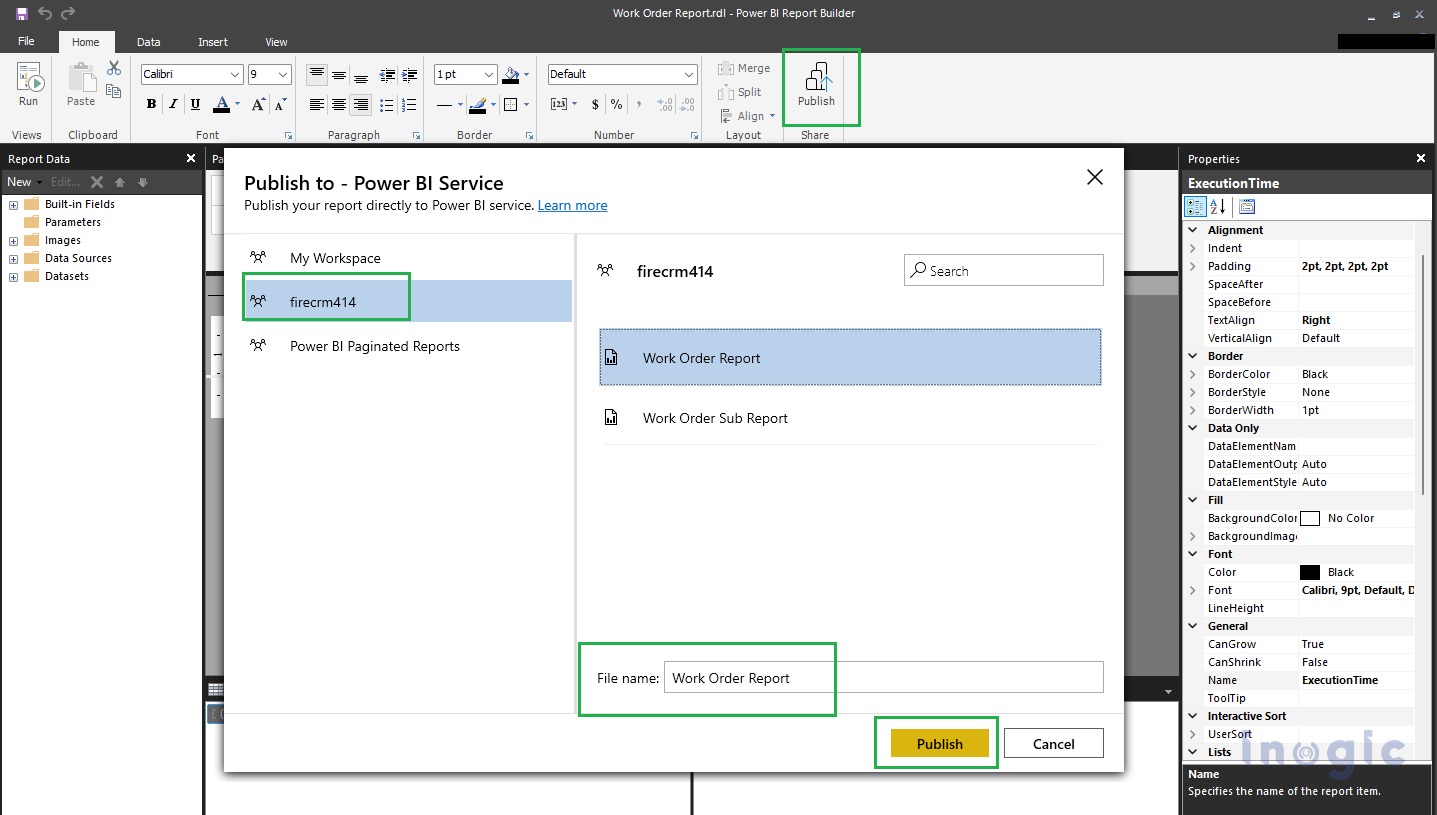
Now publish these reports to the Dynamics 365 CRM using Publish button, as shown in the below screenshot.
We have two Work Orders posted today, as below:
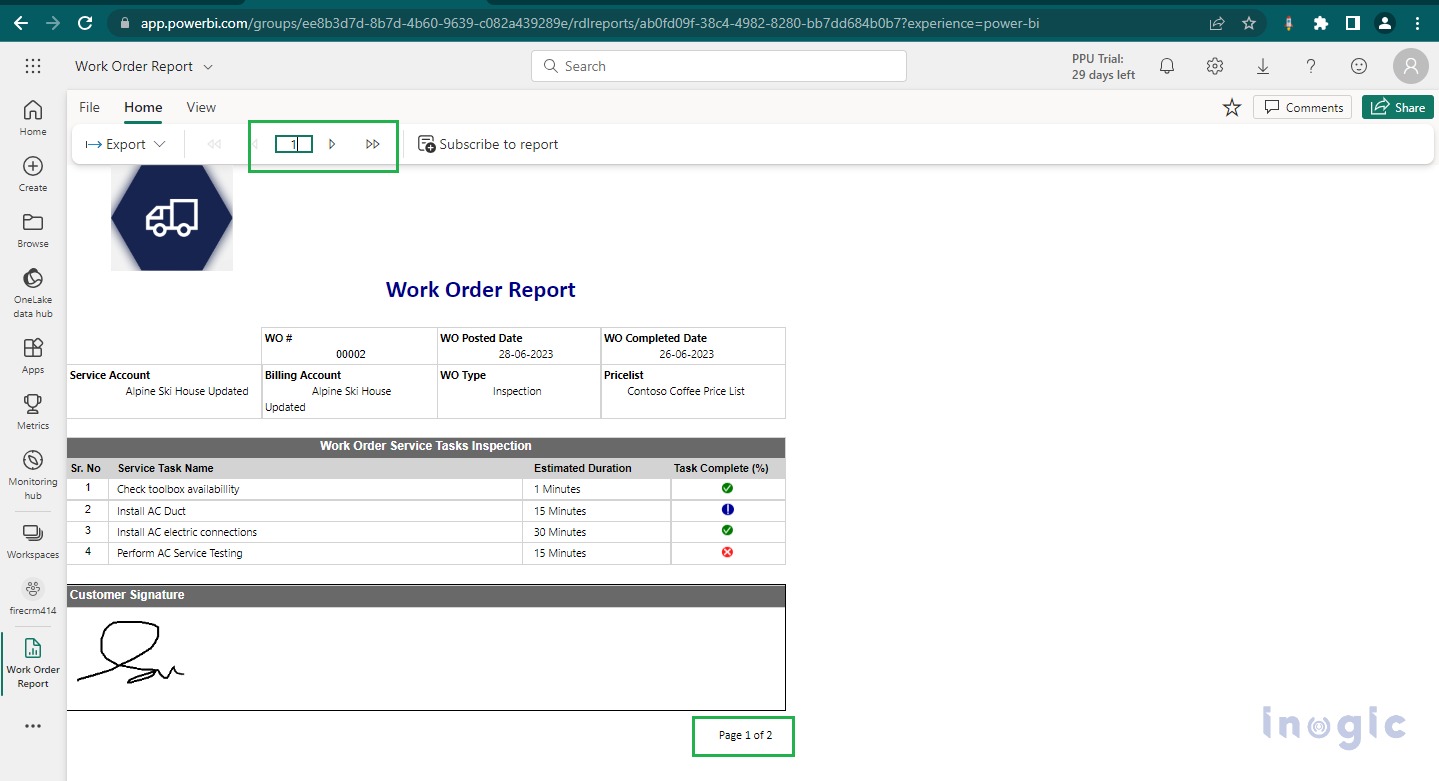
We will be able to see these published reports within the Power BI Service (https://app.powerbi.com), as shown in below screenshot.
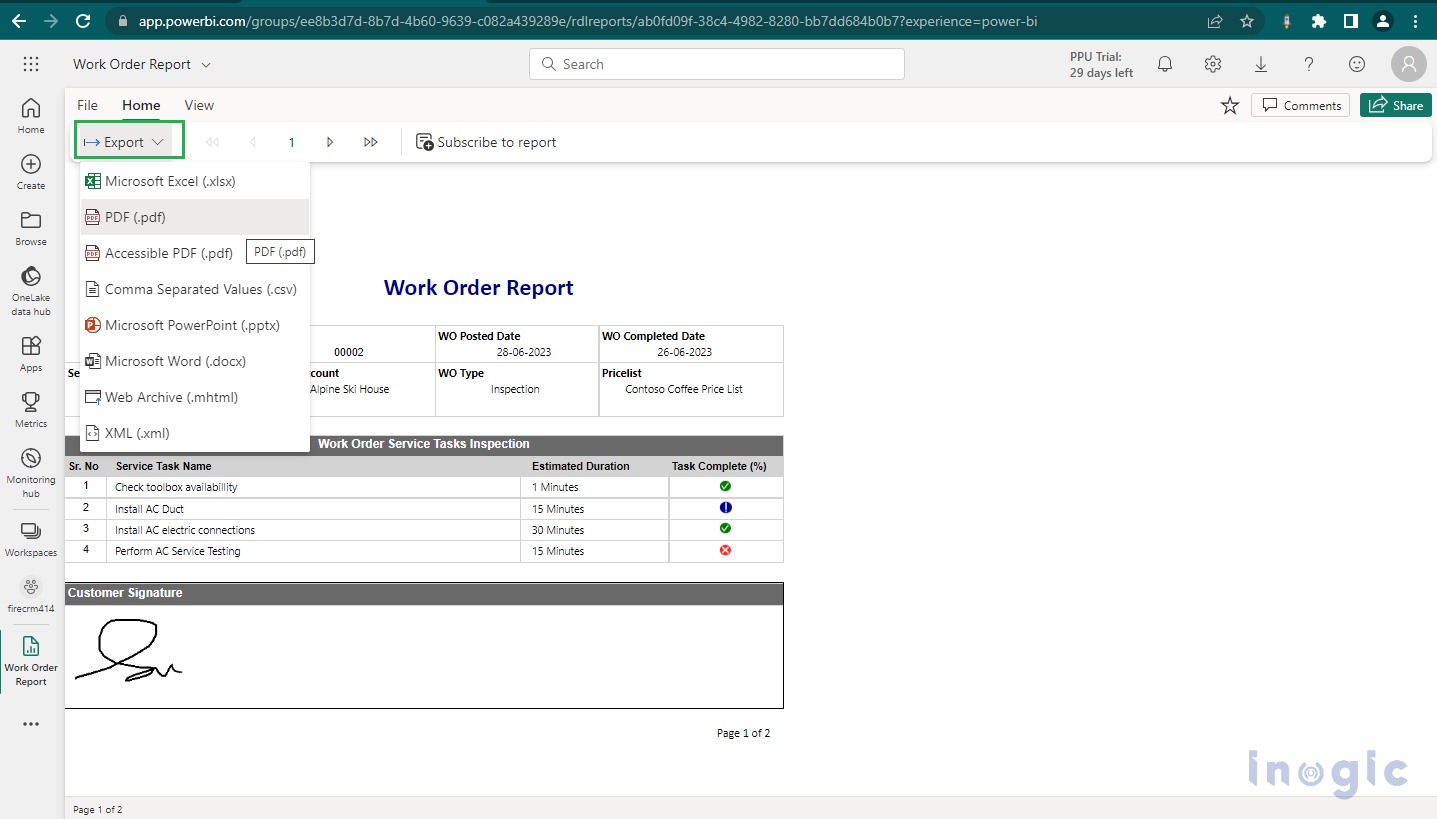
Power BI also provides ability to export the report in various formats, such as Excel, PDF, CSV, Power Point Presentations, Microsoft Docs, and so on. Please refer to the below screenshot.
Conclusion
This Paginated Report within Power BI allows enhanced features to develop reports for an organization.