The initial release of Plan Designer delivered strong capabilities for generating detailed requirement documentation, but it lacked one critical component: visualising how those requirements come together as a complete business process. Without a visual workflow, teams had to interpret written requirements on their own, often leading to gaps in understanding, misalignment between business and technical teams, and difficulty identifying decision points or process branches early in the planning phase.
In our earlier blog, we explored how Plan Designer provides a structured, AI-assisted approach to turning business ideas into actionable solution plans by capturing user stories, defining functional requirements, and generating system-level proposals. While powerful, that release still required users to manually imagine the end-to-end workflow, leaving room for confusion during implementation.
What Was Missing in the Previous Plan Designer?
The previous Plan Designer focused primarily on:
- Capturing user stories and functional requirements in text form
- Generating technology proposals and implementation suggestions
- Creating structured documentation
What it couldn’t do:
- Automatically visualize workflows – There was no way to see how requirements connected as an end-to-end process
- Show process stages and decision points – Teams couldn’t easily identify where decisions were made or how the process branched
- Provide a shared visual language – Business stakeholders and developers had no common diagram to reference during discussions
- Validate process flow before development – Without a visual representation, it was difficult to spot gaps or inefficiencies in the planned workflow
This meant that even with excellent documentation, teams still needed to create separate process diagrams manually or risk building solutions based on different interpretations of the requirements.
Introducing Process Diagrams: Bridging the Visualization Gap
Microsoft has now introduced Process Diagrams as a new preview capability that directly addresses these limitations. This intelligent visualization layer automatically converts your written requirements into structured, end-to-end workflows, providing what was previously missing: a visual representation of how your business process actually flows.
Process Diagrams are automatically generated visual flows that represent the business process described in your user requirements. As you write or refine your requirements, Plan Designer interprets them and creates:
- Process Stages (high-level workflow phases)
- Process Maps (detailed tasks, decisions, events)
This visual clarity strengthens collaboration between business users, consultants, and implementation teams, ensuring everyone understands the intended process before any automation or app development begins.
In this blog, we take a closer look at how Process Diagrams work using a simple D365 Sales lead follow-up scenario, demonstrating how this enhancement brings even more value to the planning experience.
Generating Process Diagrams: Simple Lead Follow-Up Workflow in D365 Sales
To make the experience easy for new users, we’ll use a basic scenario familiar to every D365 Sales team:
“When a lead is created in Dynamics 365, a follow-up task should automatically be assigned to the sales representative. The rep completes the task by contacting the lead and logs the activity. Based on interest, the lead is either qualified into an opportunity or disqualified.”
This scenario is simple but powerful enough to demonstrate how Process Diagrams help visualize and streamline real business workflows.
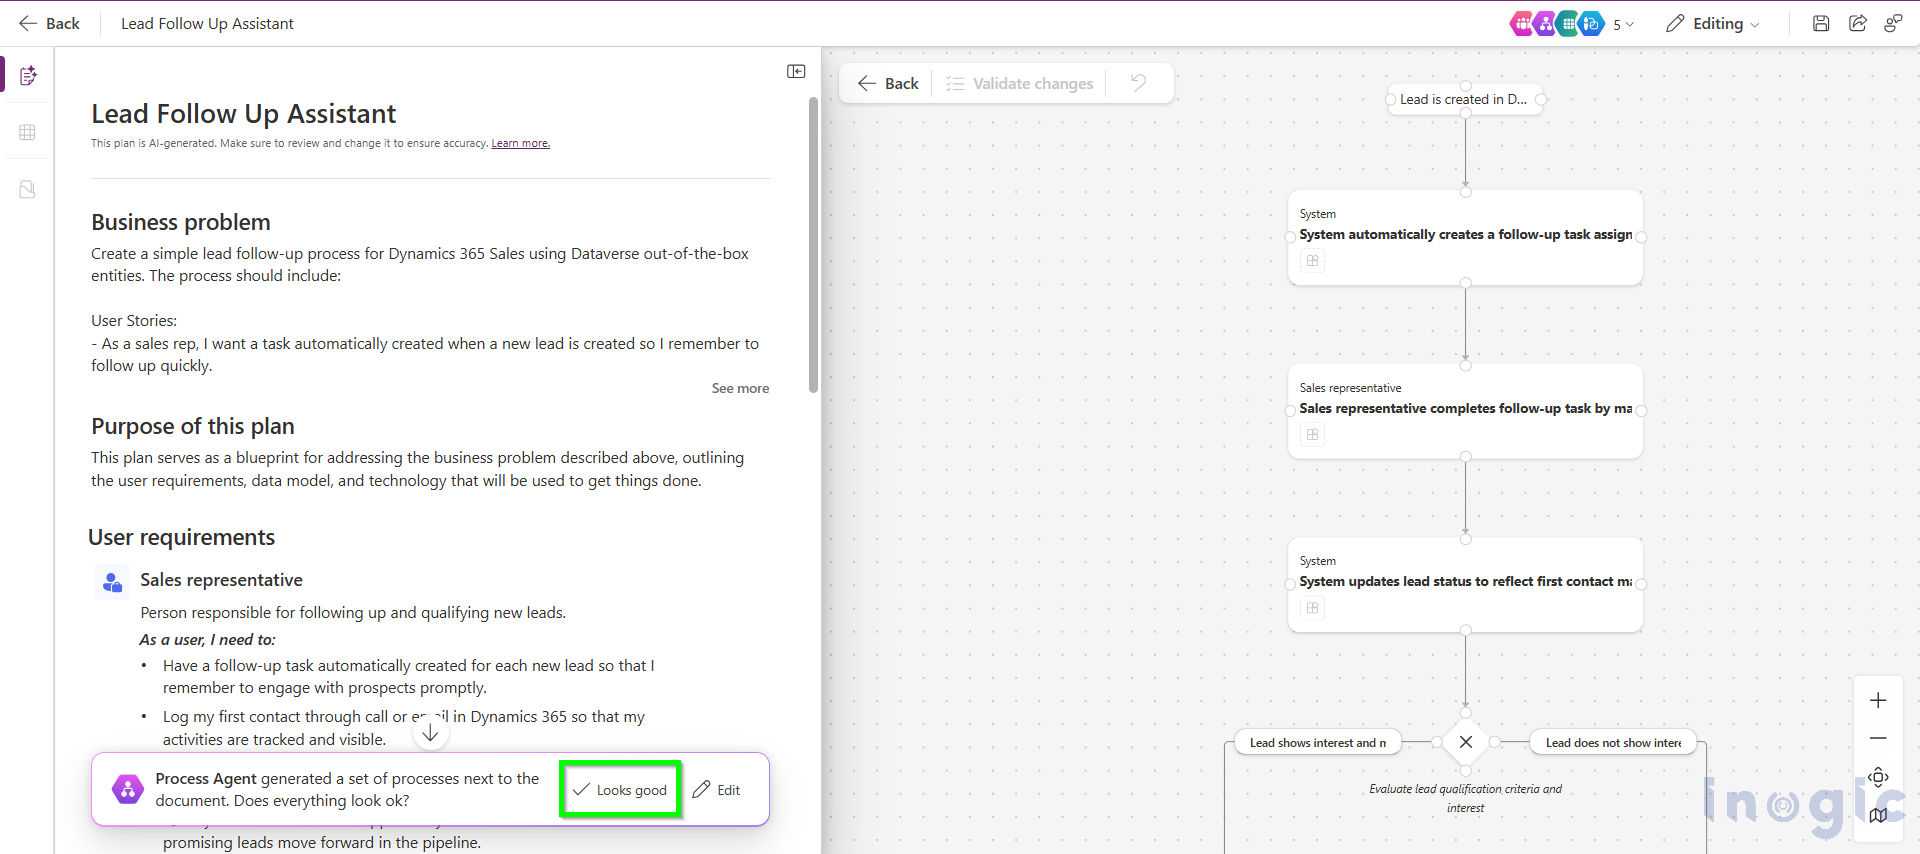
Step 1: Create User Requirements in Plan Designer
Let’s start by opening Plan Designer and describing our plane/requirement to the Plan Designer, and functional requirements such as:
- Sales reps need tasks created automatically for new leads
- Reps must log an email or call during the first follow-up
- Managers want visibility into qualification decisions
- System must update lead status based on rep actions
These requirements tell Plan Designer how the workflow should behave.
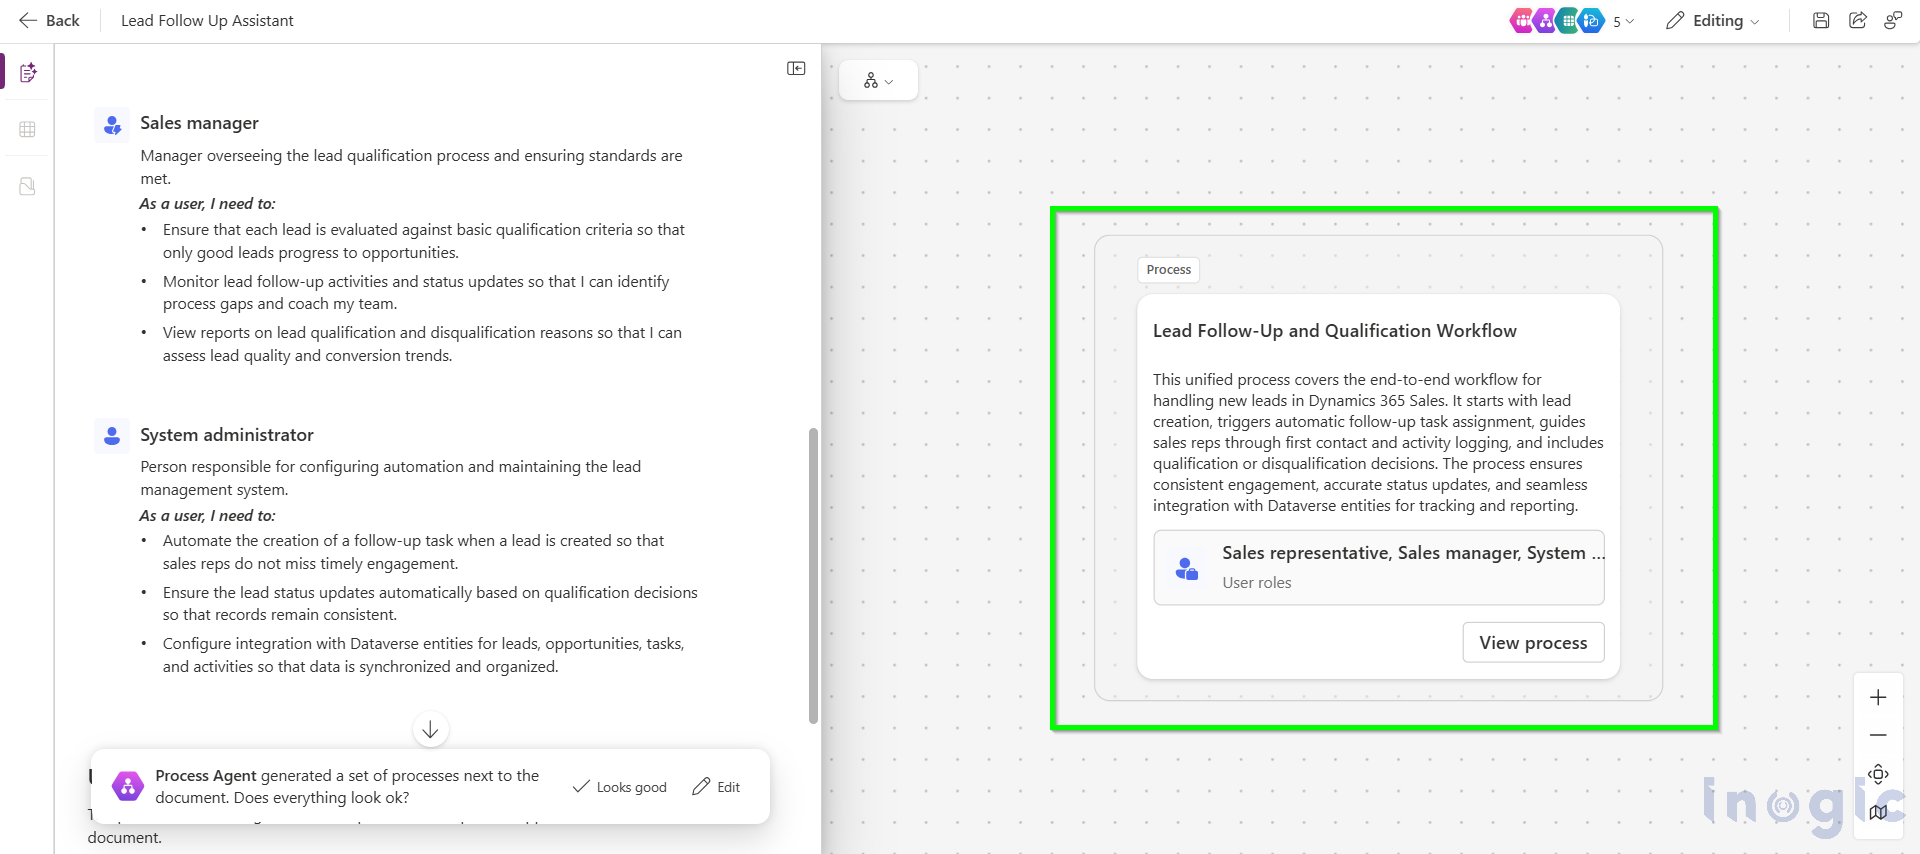
Step 2: Automatically Generate the Process Diagram
Once your user requirements are defined and accepted, i.e., by clicking on “Looks Good”. Plan Designer automatically creates a Process Diagram on the right panel.
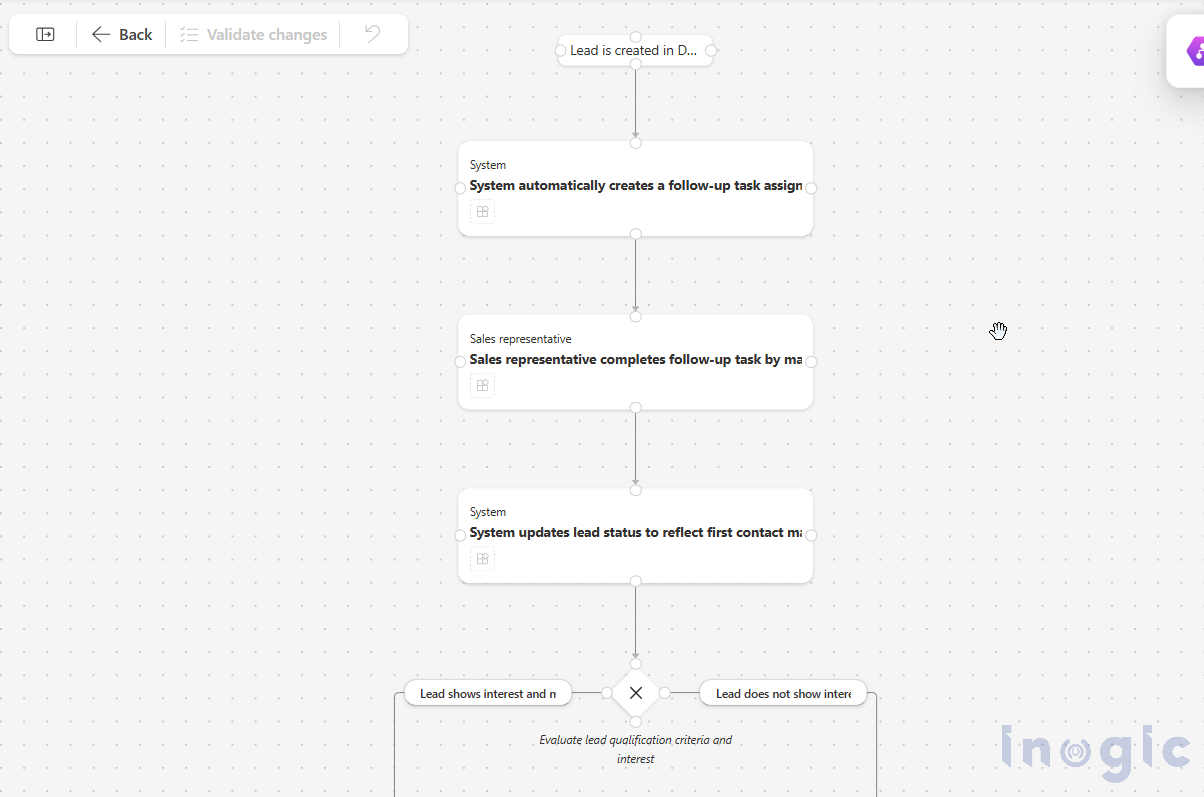
The diagram first shows the high-level stages of the process, typically starting from lead creation, moving through the first follow-up and qualification step, and ending with the outcome.
Within these stages, you’ll see a mapped sequence of actions such as creating a follow-up task, logging a call or email, evaluating the lead’s interest level, and then qualifying or disqualifying the lead. The diagram also includes key decision points like checking whether the lead is genuinely interested, helping you visualize where the process may branch.
Alongside these steps, the diagram highlights important events, such as when a lead record is created, along with system-driven actions like automatic task generation, and it clearly marks where the process concludes, either by creating an opportunity or closing the lead.
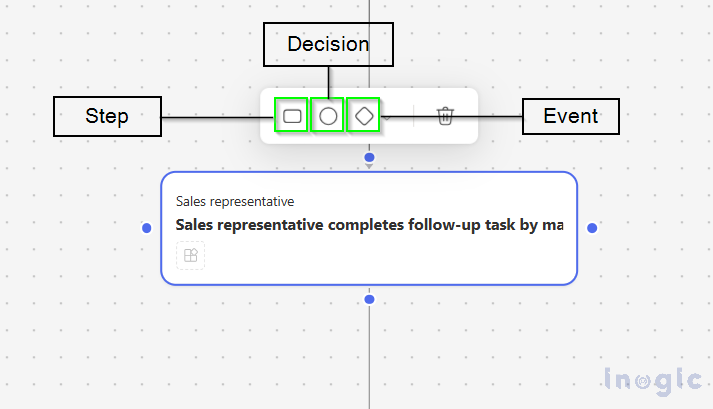
Step 3: Editing the Generated Process Diagram
Process diagrams in Plan Designer are AI-powered, which means they’re intelligent but may require refinement to perfectly match your specific requirements.
Here’s how you can work with it:
- Use Natural Language to Update the Process
The easiest way to modify your process is to use the Process Agent with natural language prompts.
e.g.: “ Add a decision to check if the lead has responded within 24 hours.”
The AI understands your intent and adds the appropriate gateway with decision branches.
- Manual Add or Modify Elements
For more precise control, use the toolbar options:
- Add Event: Insert new start, intermediate, or end events
- Add Decision: Create new exclusive gateways for decision points
- Add Step: Insert new task activities into your workflow
- Connect Nodes: Click a node’s anchor point and drag to another node to create connections
- Delete: Remove unnecessary nodes or connections (use backspace to remove connecting lines)
- Validating Your Changes
After making modifications, click the Validate Changes button. This is crucial, changes aren’t finalized or saved until validation completes. During validation, the AI reviews your edits and merges them intelligently with the existing process, ensuring logical flow and consistency.
Current Limitations to Consider (Preview Feature)
As a preview feature, process diagrams have some limitations:
- Only exclusive gateways are currently supported
- Events cannot be added manually (only through AI generation)
- Changes to the process don’t directly update technology proposals or user stories
- You cannot undo changes after validation – you can only make additional modifications
- Node types cannot be changed – you must delete and re-add them
Despite these limitations, the feature provides tremendous value in visualizing and communicating process flows during the planning phase.
Conclusion
Plan Designer’s process diagram feature represents a significant leap forward in how teams plan and communicate digital solutions. By solving the visualization gap that existed in the original release, it now provides both comprehensive documentation and visual workflow representation in one unified tool.
By automatically generating visual workflows from user requirements and allowing both natural language and manual refinements, it bridges the gap between business needs and technical implementation. Teams no longer need to create separate process diagrams, as they can avoid misalignment due to different interpretations of written requirements.
As Microsoft continues to refine this preview feature based on user feedback, we can expect even more powerful capabilities for process visualization and planning. Whether you’re building a simple approval workflow or a complex multi-stage business process, Plan Designer’s process diagrams provide the clarity and structure needed to transform ideas into reality.
Ready to visualize your next project? Turn on preview features in Plan Designer and start creating clearer, more effective process diagrams today.