Power BI, Microsoft’s Data Analytical tool works with data and provides an enhanced view of data to take further actions for customer business improvement. Microsoft has provided lots of features to be used within Power BI which will help design effective and advanced Power BI reports and dashboards to have data overview at a single glance.
Recently, we came across one of its new features called Calculation Groups. This feature takes Power BI’s ability to understand and work with data to a whole new level, making it easier to do more complicated and personalized calculations.
In this blog, we’ll walk through to understand how we can use Calculation Groups to design improvised Power BI Reports.
Pre-requisites:
Before using the Power BI Calculation Group, we need to enable the Semantic Model from the preview features pane in Power BI.
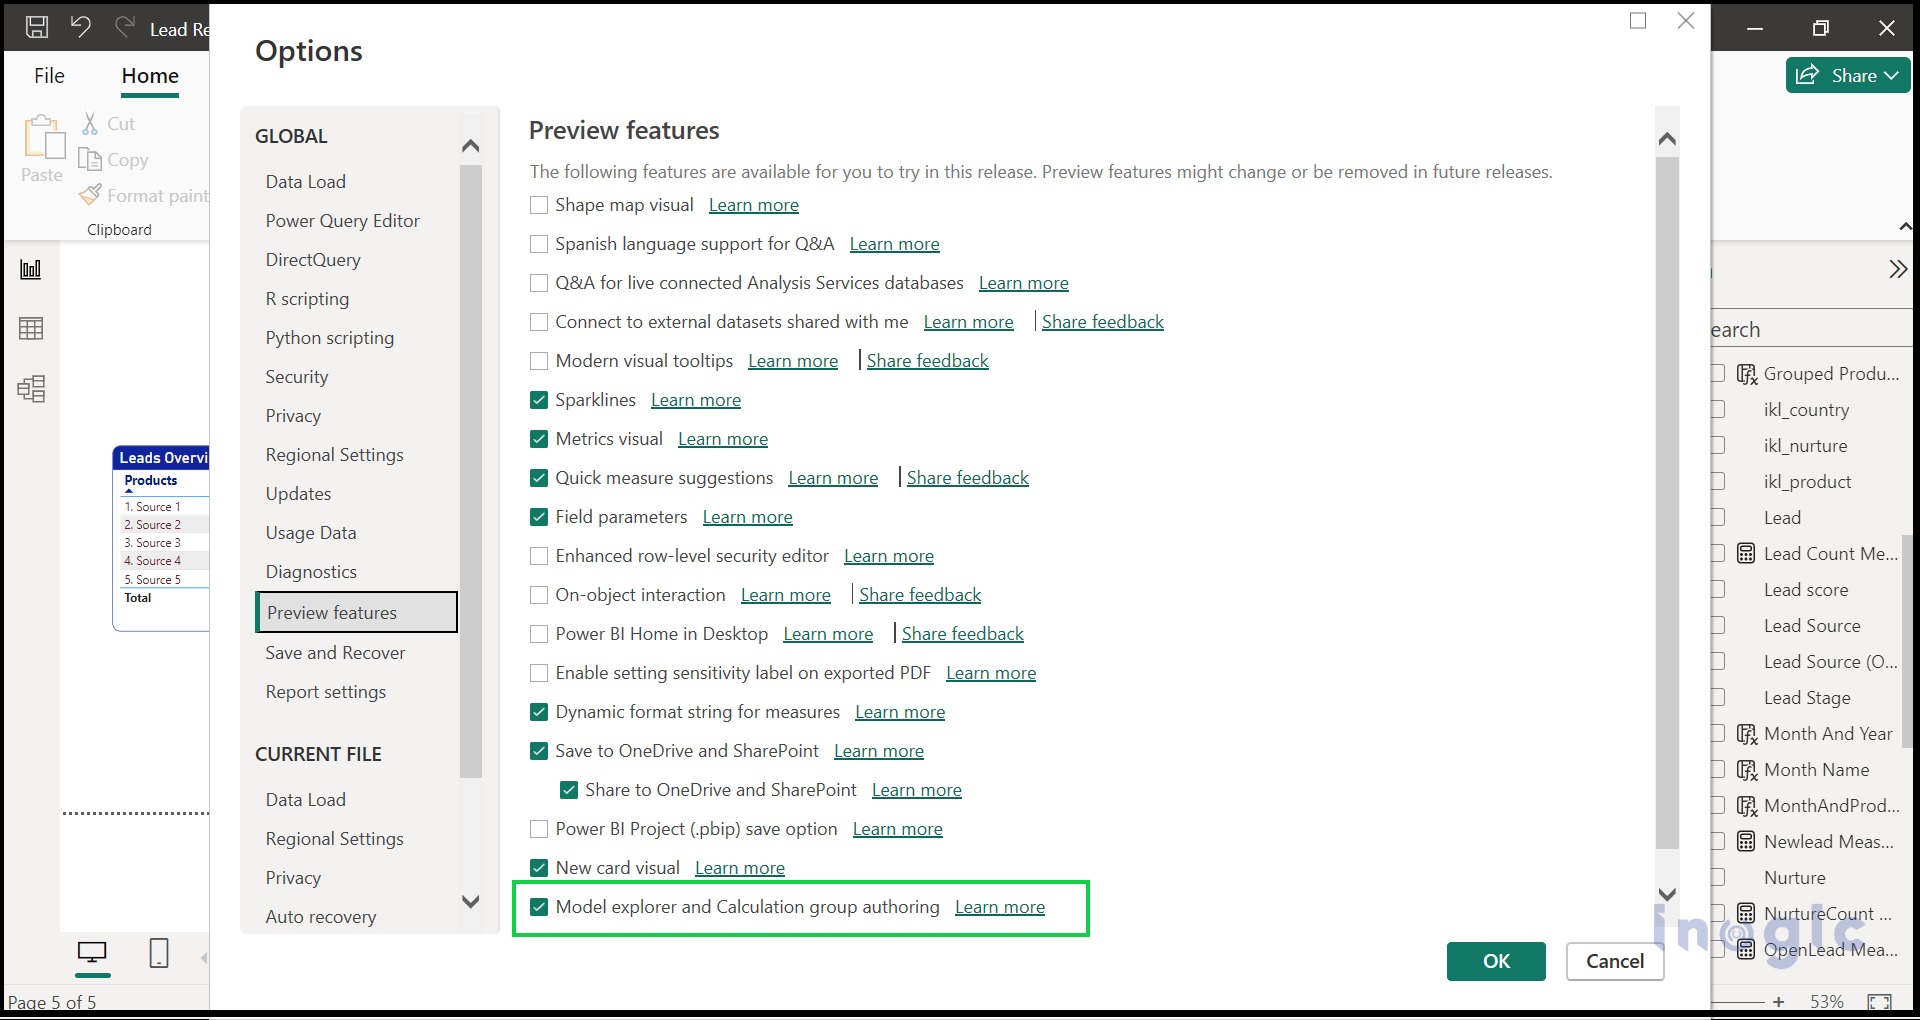
1. Navigate to the settings,
2. Expand the Preview Features,
3. Enable the Modal Explorer and Calculation Group authoring
4. Click on “OK”
5. Restart the Power BI Desktop APP
6. After restarting the Power BI Desktop, Expand the Modal View in Power BI Desktop,
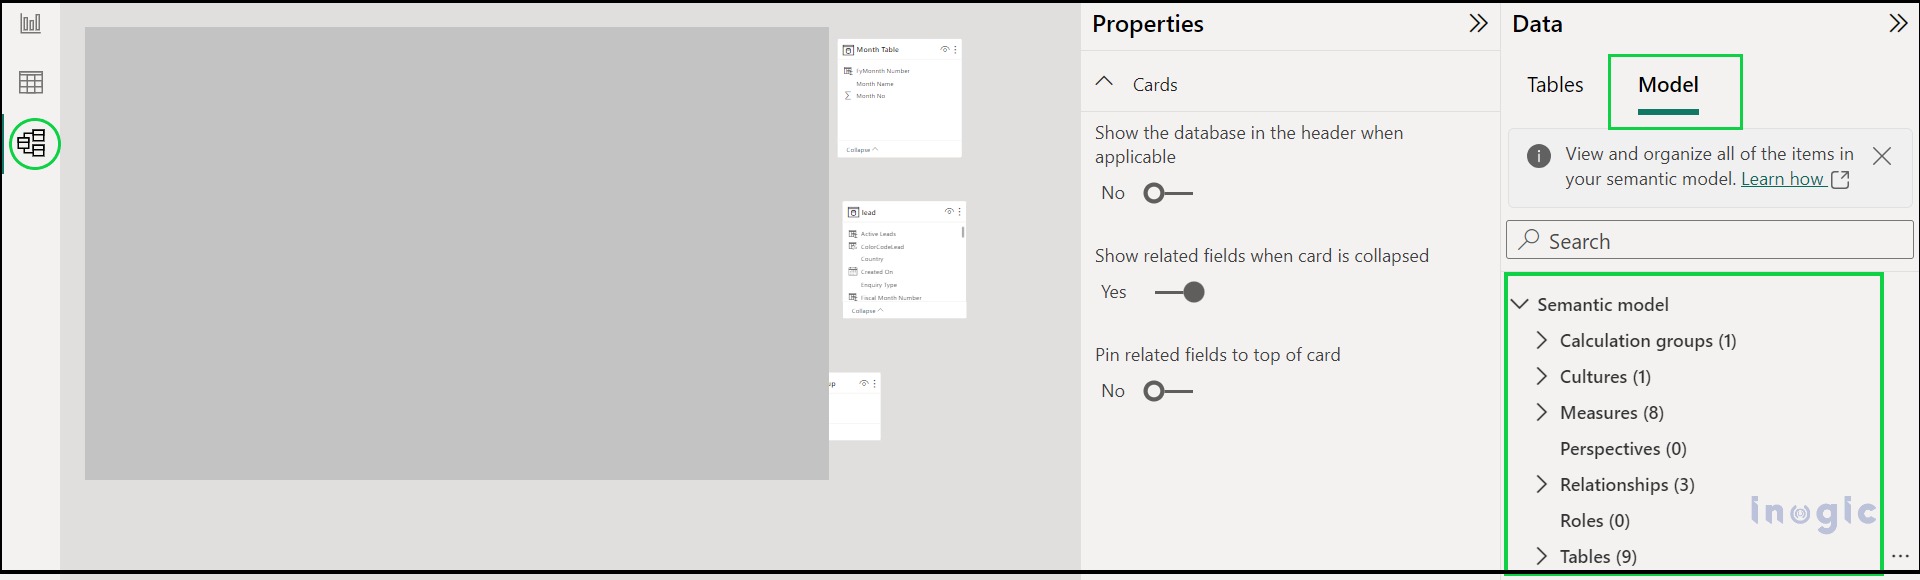
In the screenshot provided above, on the right side, there’s a “Model” tab that includes Semantic Models like Measures, Cultures, Roles, and more. The Calculation Group is a part of the Semantic Model.
Now, let’s demonstrate the use of the Calculation Group in one of our Power BI reports with a real-world use case scenario within the Power BI report. We will use calculation Groups to calculate the Lead Counts based on two aspects:
- Lead Status i.e. Open Leads, Qualified Leads
- Created On Date i.e. Monthly Created Leads, Quarterly Created Leads, and Yearly Created Leads
Previously we used to create separate measures for each of these Lead Count calculations in the Power BI report as shown below screenshot,
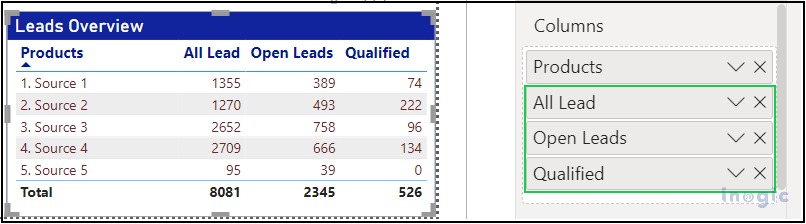
Now with a Calculation Group, we can combine these Measures and achieve the same results using a simple calculation Group Model.
In the report below, the highlighted columns represent measures that display the count of leads with various expressions. Our goal is to consolidate these measures into a Calculation Group.
Navigate to the Calculation group in the Semantic Modal,
7. Expand the Calculation Group,
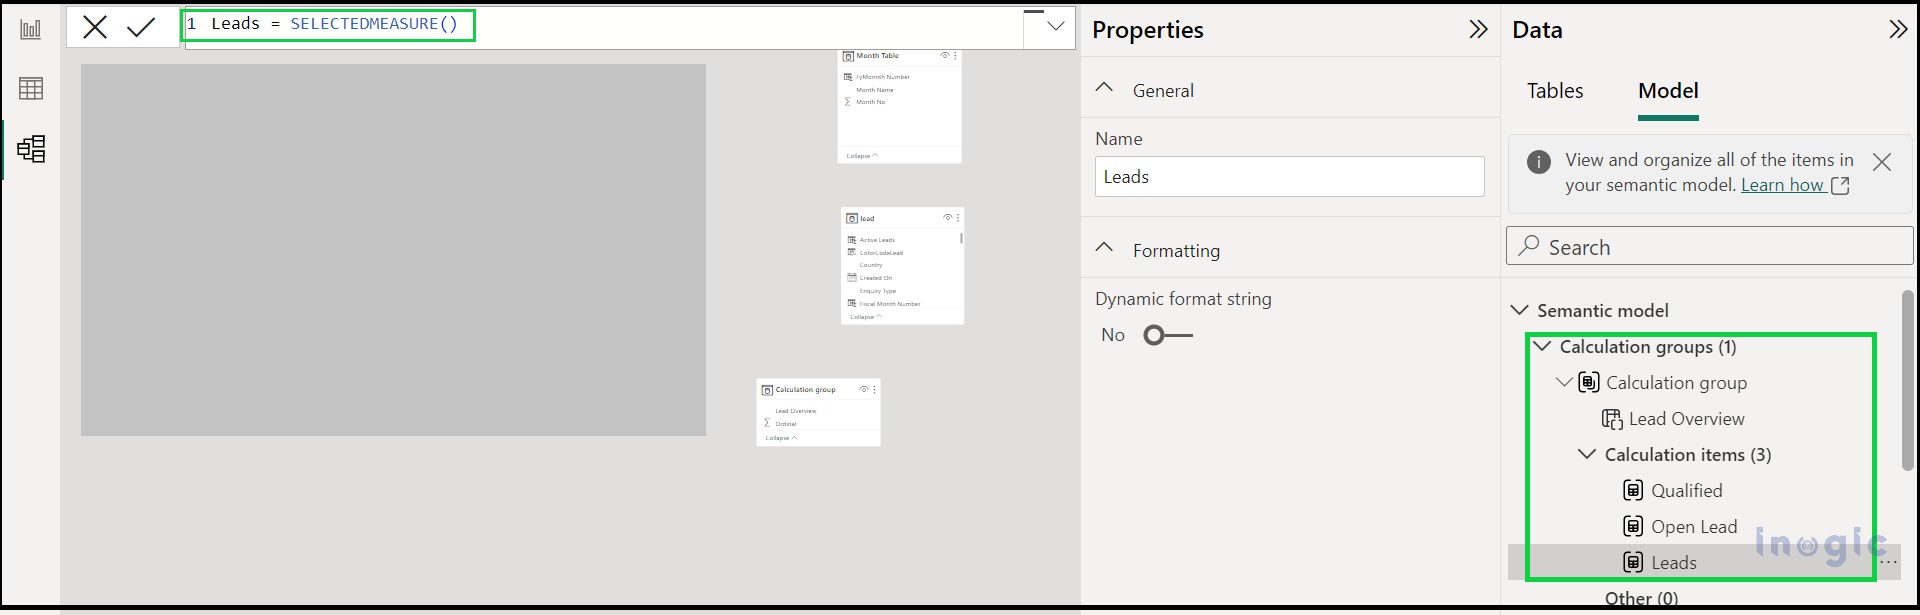
8. Create a new Calculation Group, For now, we are creating it as “Lead Overview”
9. Create the Calculation Items, these items can be created with their own expressions. We have created three items since we had three measures used in the Lead report.
Created items are provided below with their DAX expressions
Leads = SELECTEDMEASURE()
Open Lead = CALCULATE(SELECTEDMEASURE(),FILTER(‘lead’,’lead'[statecodename]=”Open”))
Qualified = CALCULATE(SELECTEDMEASURE(),FILTER(‘lead’,’lead'[statecodename]=”Qualified”))
Please refer to the screenshot given below,
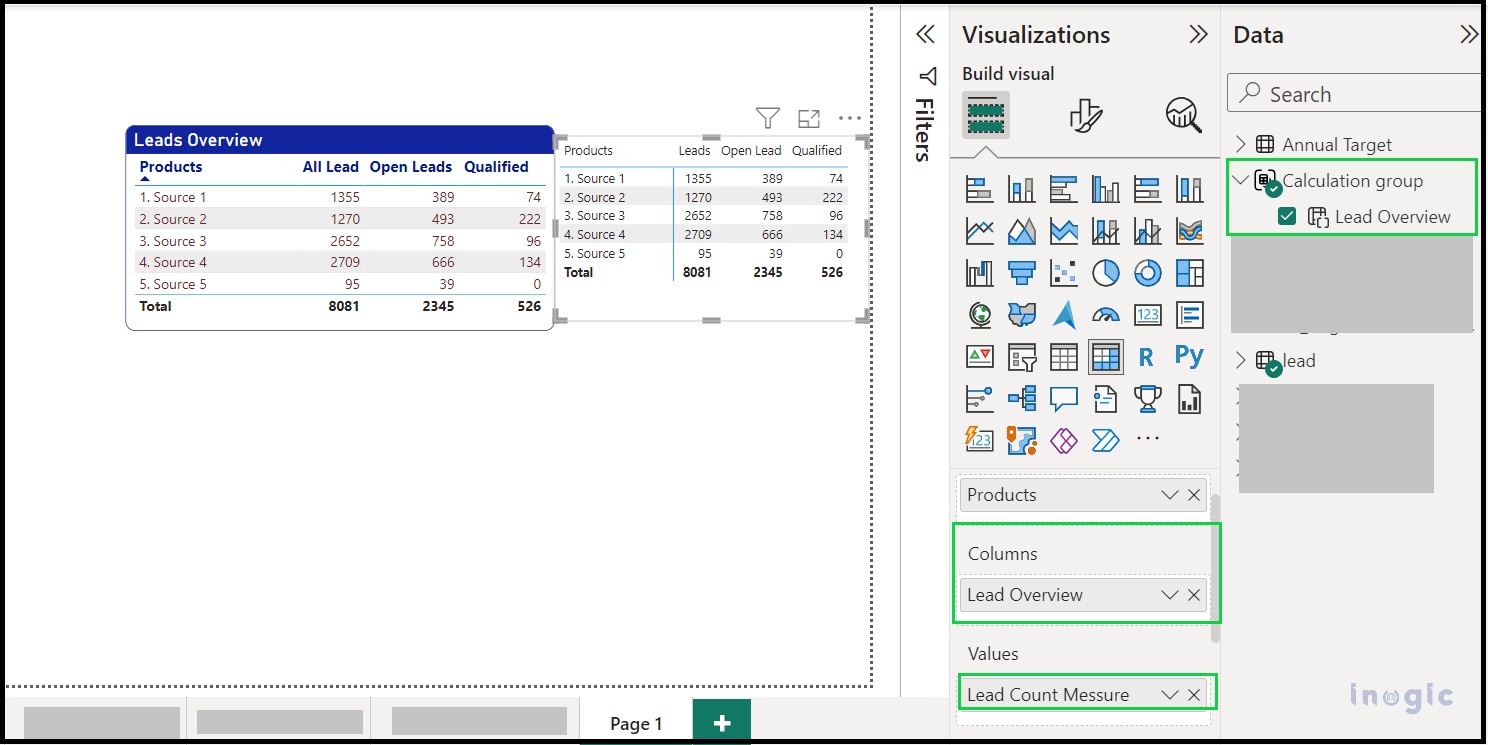
In the screenshot below, we have placed the “Lead Overview” Calculation Group in the column for the Matrix visual and included the Lead Measures in the Values section. These measures calculate the count of leads.
Here is the DAX expression for the Lead Measure:
Lead Count Measure = IF(COUNTROWS(‘lead’)=BLANK(), 0, COUNTROWS(‘lead’))
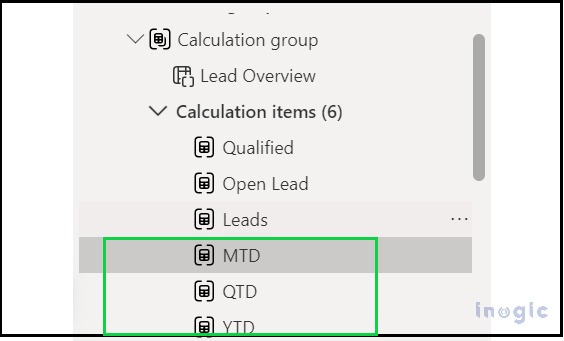
Furthermore, we can expand the Calculation Group by adding additional items. Let’s incorporate some Date KPIs. Please review the following expressions where we have introduced three new items to the existing Calculation Group:
YTD = CALCULATE(SELECTEDMEASURE(),DATESYTD(‘lead'[Created On]))
QTD = CALCULATE(SELECTEDMEASURE(),DATESQTD(‘lead'[Created On]))
MTD = CALCULATE(SELECTEDMEASURE(),DATESMTD(‘lead'[Created On]))
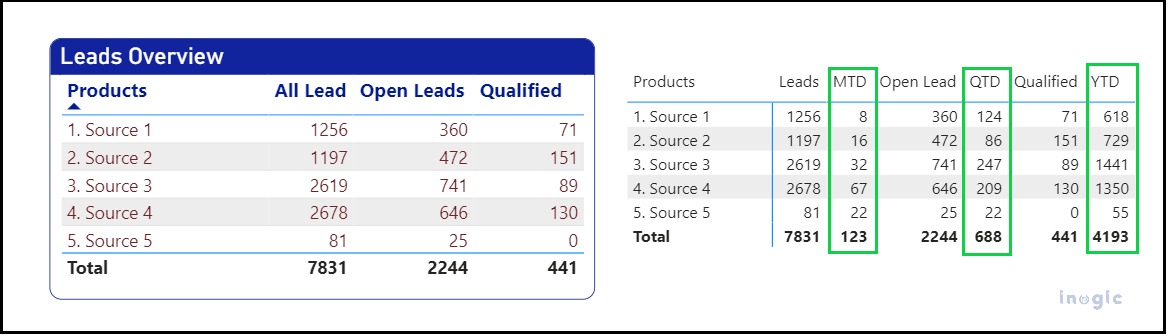
We previously discussed the dynamic switching benefits of the Calculation Group. After incorporating these new items into the Calculation Group without making any alterations, any updates or modifications to the Calculation Group will automatically be reflected in the Power BI Report.
Please refer to the screenshot given below,
Conclusion
In conclusion, the utilization of Calculation Groups in Power BI offers significant advantages for organizing and managing complex calculations within reports. By leveraging Semantic Models, we can efficiently structure and consolidate measures, such as Date KPIs and more, ensuring that updates and modifications seamlessly propagate throughout our Power BI Reports. This empowers users to create more dynamic and responsive reports, enhancing the overall data analysis experience. Calculation Groups provide a valuable tool for enhancing the clarity and flexibility of Power BI reports and are a key asset for data professionals and analysts.