Power BI is an interactive data visualization tool that is used to create business reports. It makes business-level decisions easy. Visuals are the visualization tools that display the data in Power BI. There are many types of visuals based on different needs and requirements. A Card is a way to enhance the data in a card form. It can be used to display aggregate metrics such as count, the maximum number of leads, the first, the last, and so on. There is a new visual introduced in Power BI i.e. Card (new). It extends the functionality of a standard Card visual. Unlike the standard card, which only supports one field, the Card (new) has a grid property. This means you can add multiple fields on the same visual. It allows you to encapsulate the data in one card.
Consider a scenario, where we have to visualize data such as max, min, count, first, last, and so on in a Power BI dashboard where we have used the old or standard cards to show the count of accounts. Four card visuals are used to display the data. Now suppose there are some changes in the data that need a change in the fields for each Card visual accordingly. In that case, we can make use of the new Card Visual which allows us to include a single Card visual with various metrics.
Let’s walk through the steps to develop a Power BI report using Card (new) visual which will help us to enhance the use of visuals to easily display data with a better interface.
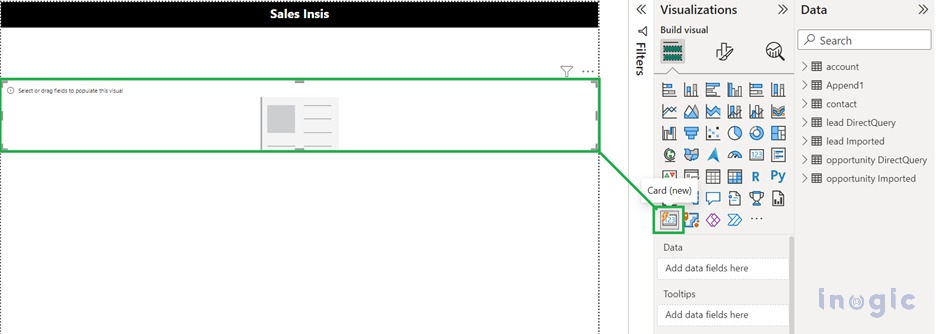
Step 1: Navigate to the Power BI Desktop app, within a report add the Card (new) Visuals,
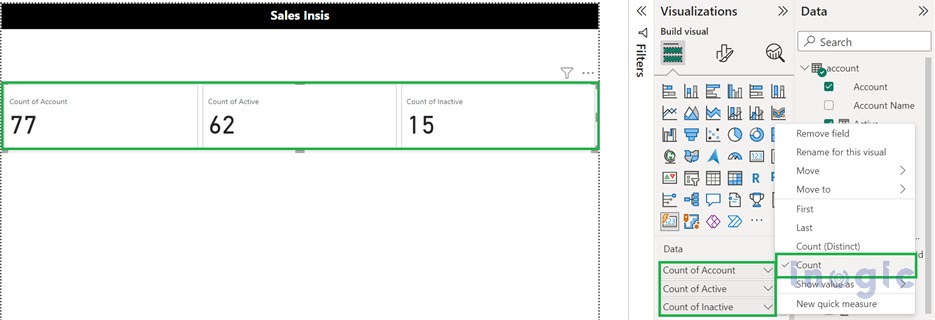
Step 2: On the Data add the required fields and set it as Count,
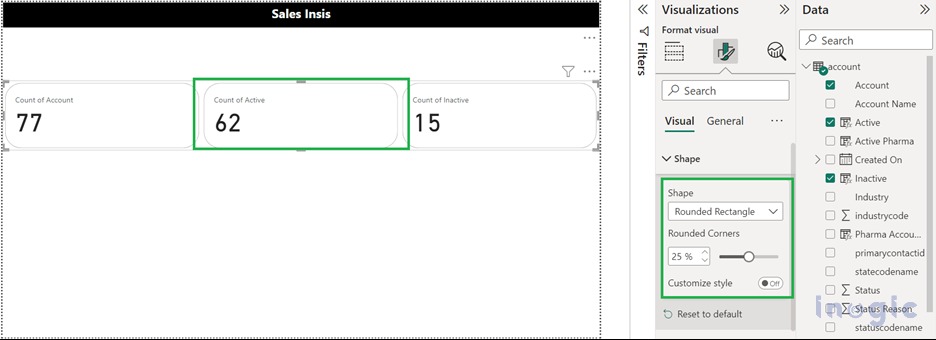
In the Format visual there are many options available to deal with how the data should be represented on the Dashboard,

Step 3: In the Format Visual expand the Shape, there are a few shapes for the cards inside the Card (new) Visual.
Step 4: In the format, visuals navigate to general, there we can Set One Title for all the Cards, Individual Data alignment, Card labels, and so on.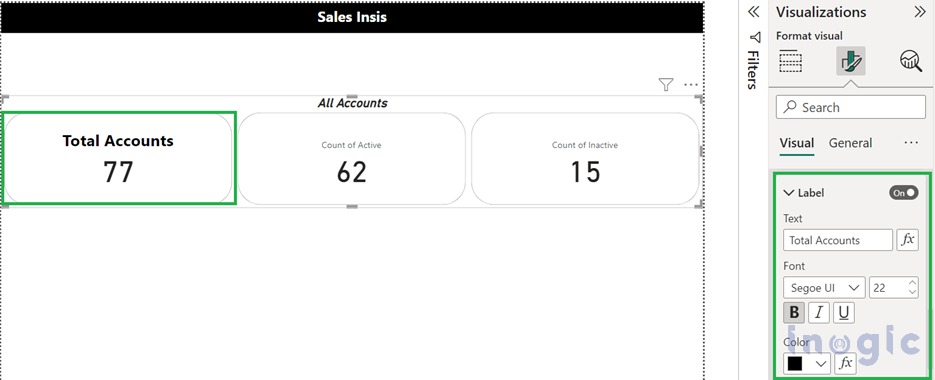
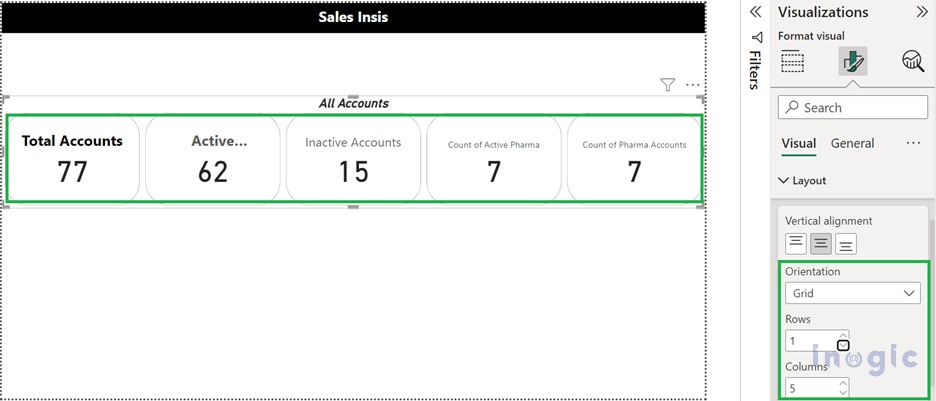
Step 5: You can Extend New Card (new) as Grid, which adds Rows and Columns to the Cards.
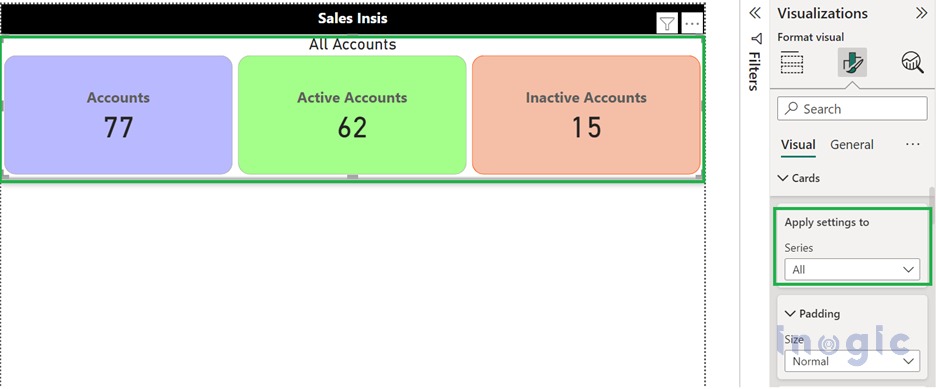
Step 6: Now let’s have some UI changes for individual Cards in the Card (new) Visual,
Let’s have a Red color grade for Inactive, and Green for the Active Accounts
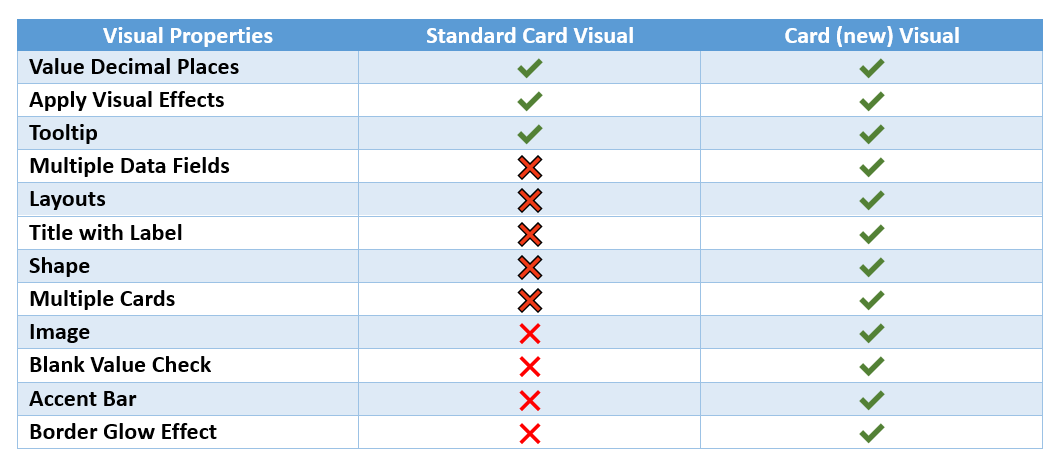
There are various properties we can set up with the Card Visual and can compare available properties for both the standard card visual and the new Card visual.
Please refer to the below comparison for the same.
Conclusion
The Newly added Card visual gives us the ability to enhance the functionality of a standard card visual with its robust features.