In modern B2B selling, revenue rarely depends on one contact. It depends on networks, influencers, decision-makers, sponsors, blockers, subsidiaries, and cross-functional teams.
Yet in many organizations using Microsoft Dynamics 365, those relationships live across multiple records, forms, and dashboards. The data exists. The clarity doesn’t.
This guide explores how CRM data visualization, relationship mapping, org chart structures, and influence mapping can transform Dynamics 365 into a true engine of CRM Relationship Intelligence, helping teams build strategic relationships and unlock revenue potential across key accounts.
What is Relationship Mapping in Dynamics 365 CRM?
Sales complexity has changed.
- Buying groups are larger
- Decisions are distributed
- Influence flows sideways, not just top-down
- Parent-child account structures affect revenue strategy
Without visual context, CRM becomes transactional instead of strategic.
Relationship mapping solves this. It turns disconnected records into an interactive visual network — allowing teams to:
- Visualize account relationships with ultimate clarity
- Know exactly how well and often they’re connecting with strategic accounts
- Identify hidden influencers and decision makers
- Build relationship maps faster without switching screens
This is not just visualization. It’s strategic visibility.
What Is CRM Data Visualization in Dynamics 365?
CRM data visualization refers to transforming structured CRM data, accounts, contacts, opportunities, and connections into interactive visual formats.
Instead of navigating through multiple tabs and related lists, teams can:
- See entire relationship ecosystems on one screen
- Understand influence chains instantly
- Explore complex hierarchies with unlimited N-level drill-down
- Analyze relationship health and ownership patterns
This is where a modern Relationship Mapping tool for Microsoft Dynamics 365 becomes essential.
Core Visual Formats for Relationship Mapping
Different sales scenarios require different visual perspectives. A powerful solution supports multiple views to enhance CRM Relationship Intelligence.
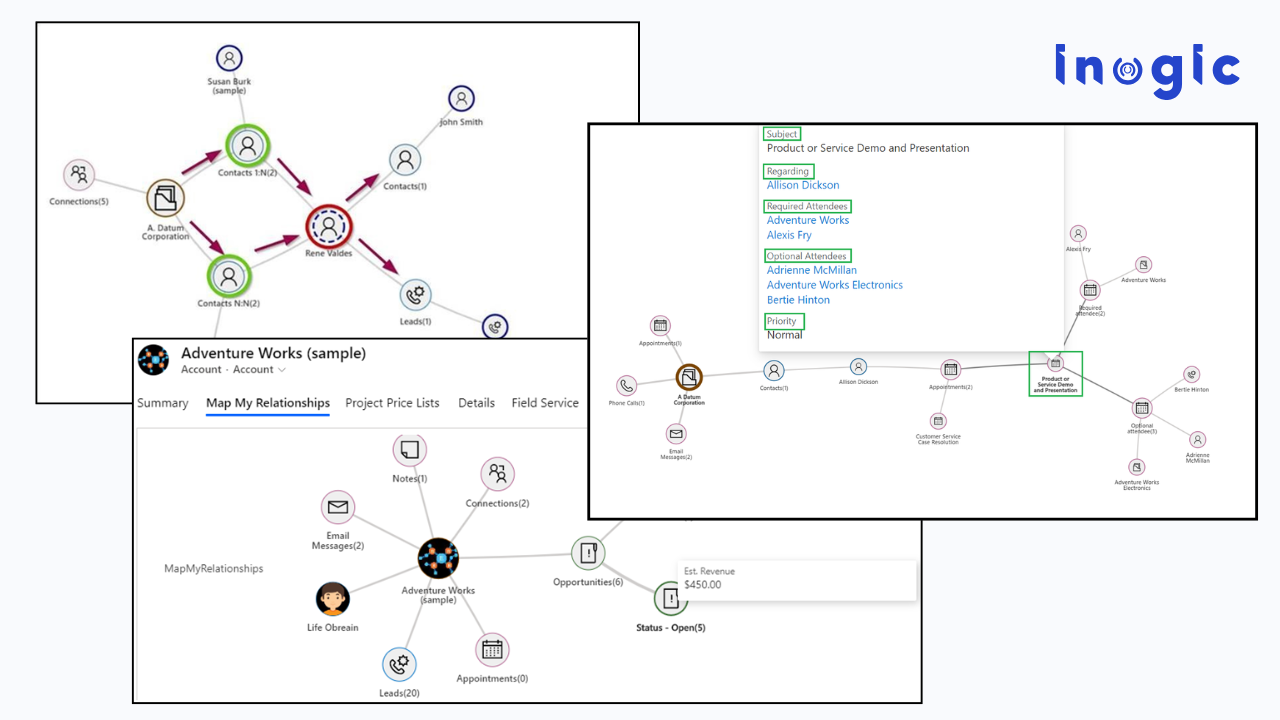
1️. Mind Map View including Spider View for Influence Mapping
The mind map view (also known as spider view) places a central account or contact in the middle and expands all connected records around it.
Ideal For:
- Influence mapping
- Stakeholder discovery
- Identifying indirect connections
- Visualizing cross-team impact
Key Outcomes:
- Auto-expand nodes to instantly uncover deeper influence networks
- Color-coded connection roles to identify champions, decision-makers, and blockers
- Display record images within nodes for instant stakeholder recognition
- Perform quick actions directly from visual nodes
This view helps revenue teams understand not just who is connected, but how influence flows.
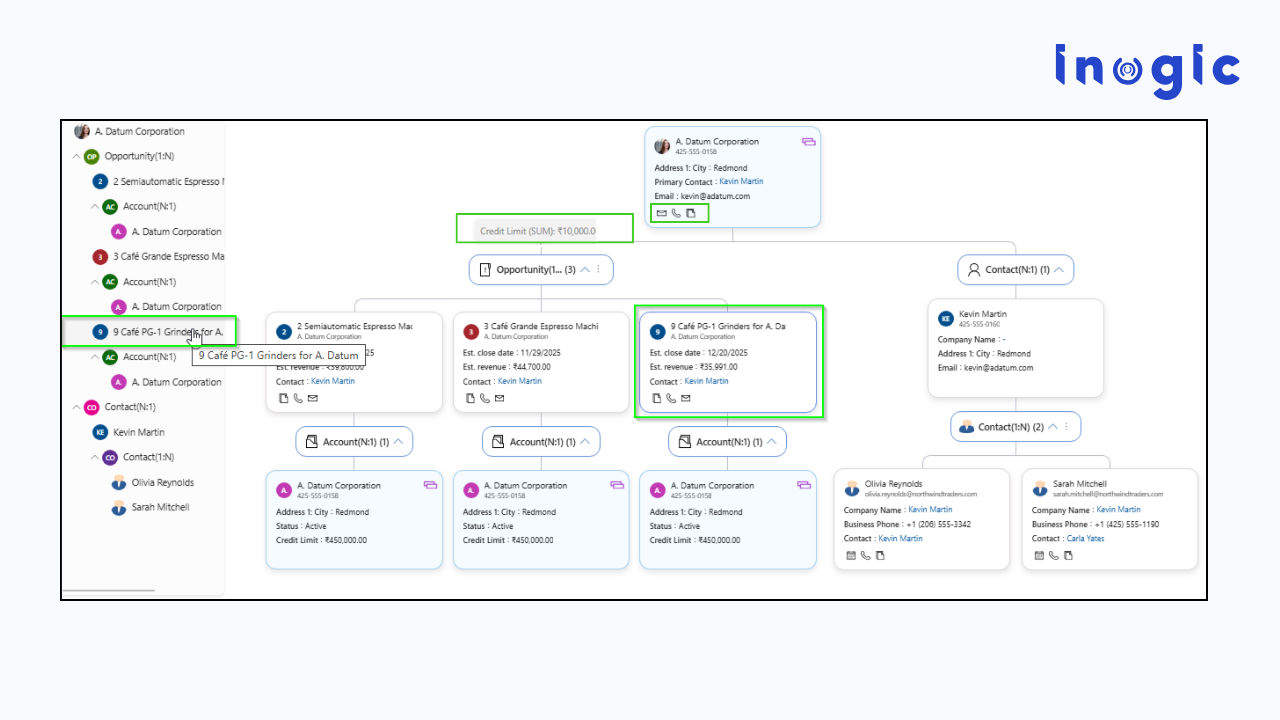
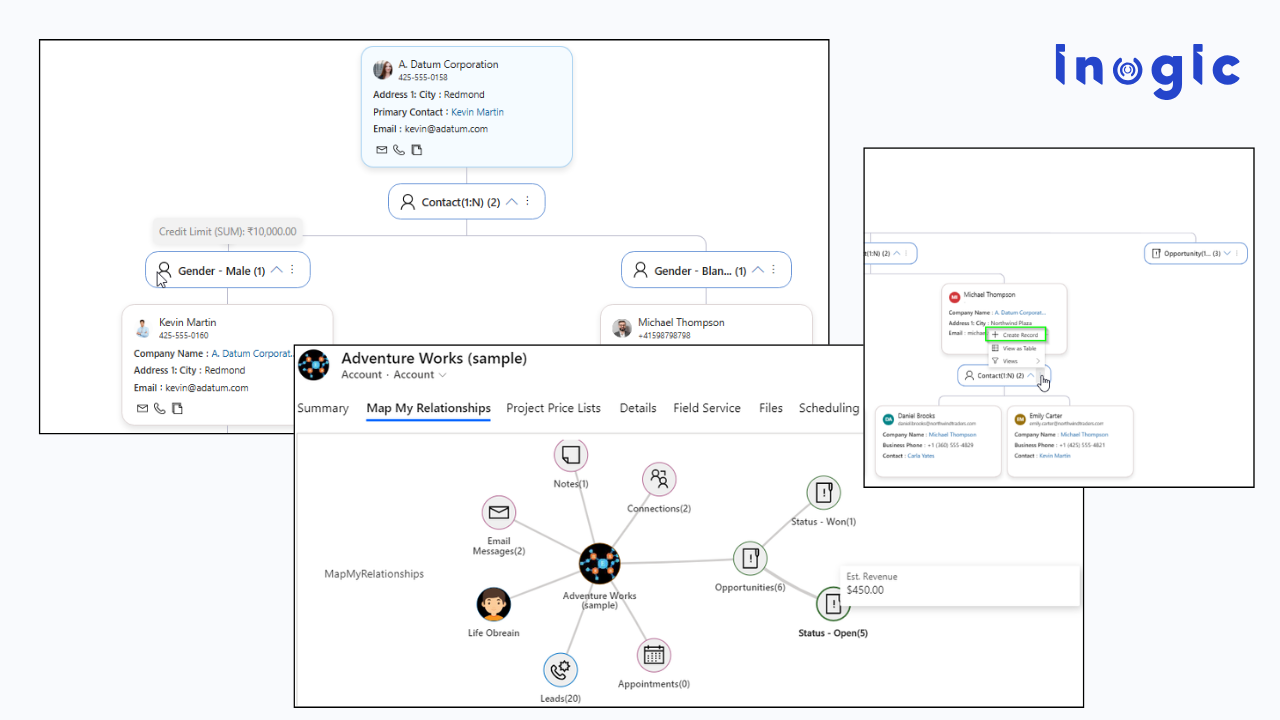
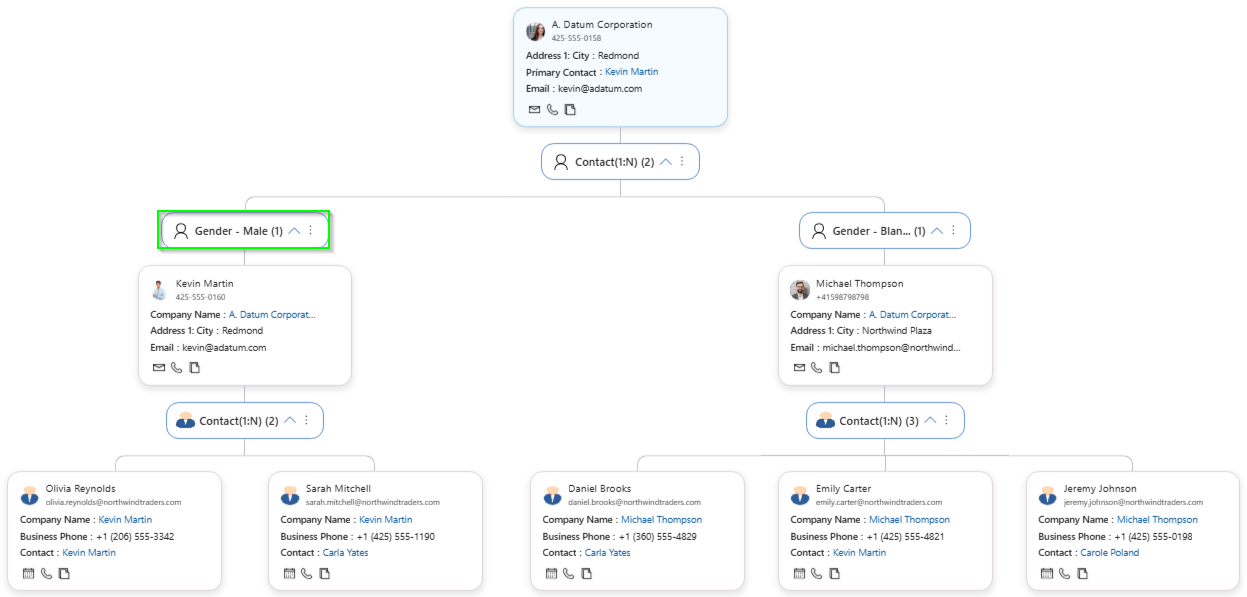
2️. Tree View for Structured Relationship Analysis
The tree view provides a structured top-down representation of account hierarchies and reporting structures.
Ideal For:
- Parent–child account hierarchies
- Corporate structure visualization
- Territory and ownership mapping
- Multi-level deal analysis
Key Capabilities:
- Unlimited N-level relationship drill-down
- Tree navigation panel with upper-level and sibling visibility
- Expand hierarchy branches instantly
- Built-in grouping and real-time aggregation (sum, count, etc.)
This format turns complex CRM relationship structures into a clear relationship mapping org chart for strategic decision-making.
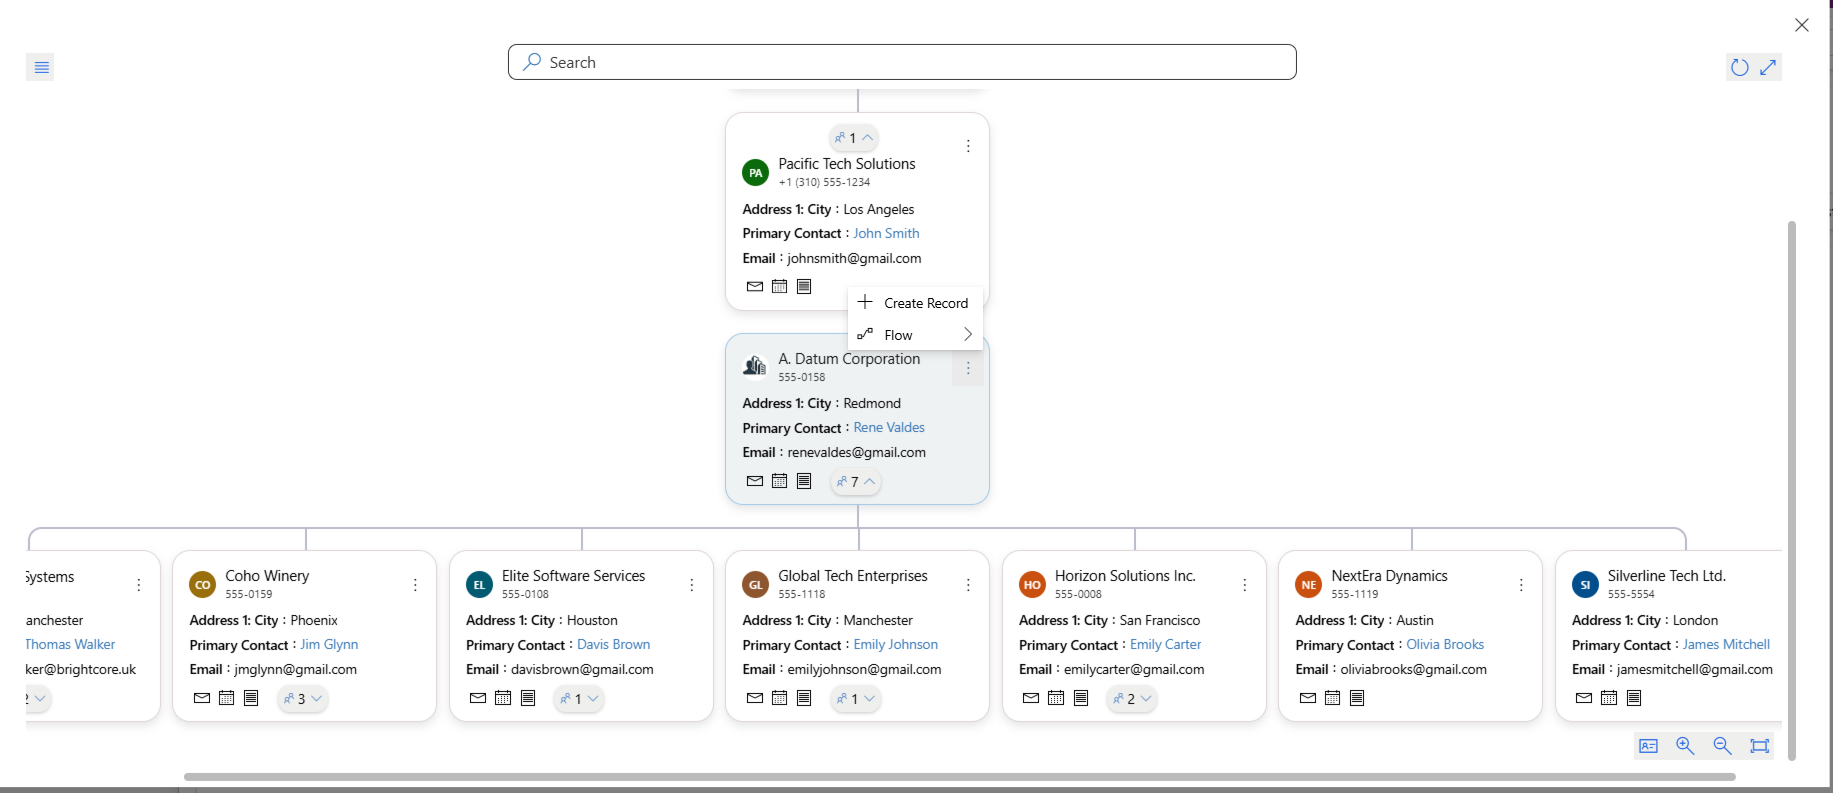
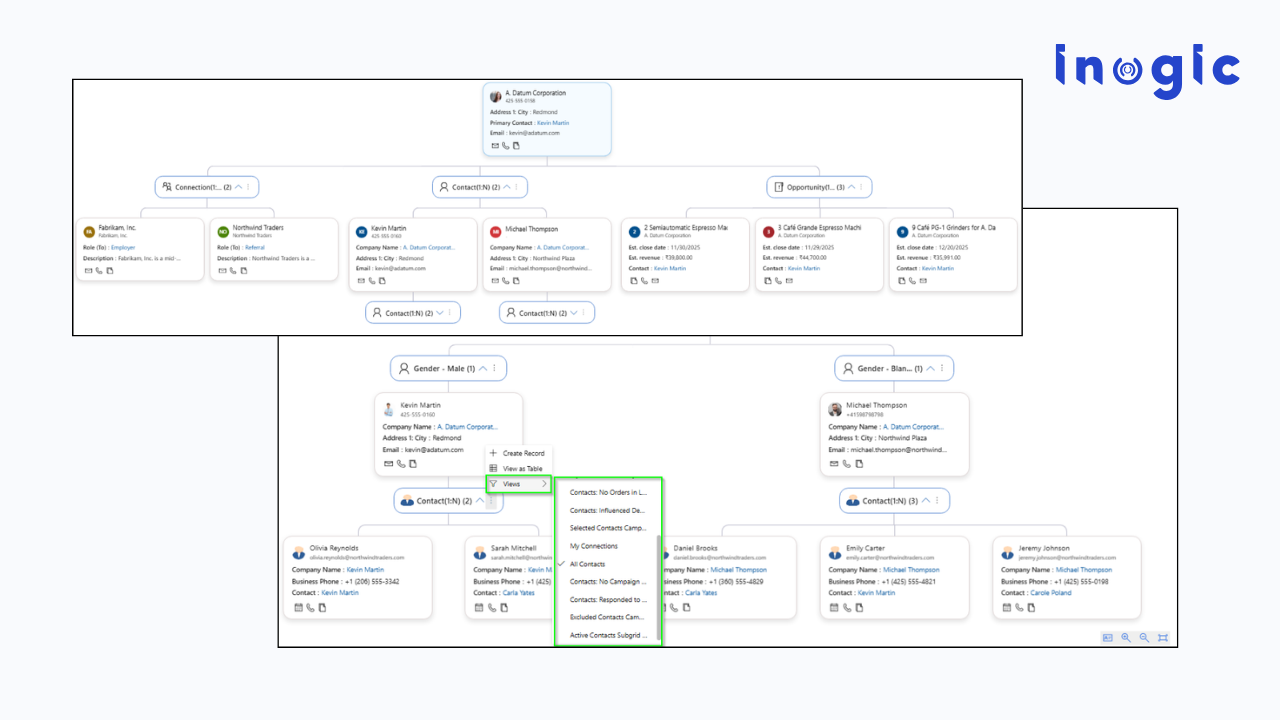
3️. Hierarchy Control for Enterprise Account Intelligence
Hierarchy control enables structured visualization of accounts, opportunities, and custom entities — without navigating multiple forms.
Why It Matters:
Enterprise selling requires clarity across:
- Global subsidiaries
- Regional divisions
- Opportunity rollups
- Cross-functional stakeholders
Advanced Outcomes:
- Trigger on-demand Power Automate flows directly from the hierarchy view
- Duplicate records within visualization for fast structuring
- Switch instantly to table format for detailed CRM data analysis
- Download relationship maps as images for executive reporting
This bridges visual intelligence with operational execution.
CRM Visualization Capabilities That Drive Revenue Impact:
Beyond visualization, modern relationship mapping tools deliver strategic advantages:
360° Relationship Visualization: View Accounts, Contacts, Opportunities, and custom entities together, without switching screens.
In-Card Record Details: Access critical information directly inside visual nodes, reducing clicks and accelerating conversations.
Dynamic Filters & Custom Labels: Personalize views by role, Sales, Account Management, and Leadership.
Real-Time Aggregation: Perform grouping and analytics (sum, count) without rollup fields, enabling instant relationship-based insights.
Create & Associate Records from the Map: Maintain workflow continuity. No context switching. Higher CRM adoption.
These capabilities transform CRM from a database into a relationship intelligence platform.
Influence Mapping in Dynamics 365 CRM: The Revenue Multiplier
Influence mapping reveals:
- Who influences buying decisions
- Where executive sponsorship exists
- Where engagement is weak
- Which accounts require deeper penetration
By visualizing influence patterns, teams can:
- Build strategic relationships to unlock the true revenue potential of all key accounts
- Strengthen multi-threading strategies
- Reduce dependency on single contacts
- Increase deal velocity
This is how organizations move from reactive CRM usage to proactive account strategy.
Measuring Relationship Strength Inside CRM
Modern relationship mapping solutions help teams:
- Track engagement frequency across stakeholders
- Identify relationship gaps
- Spot under-engaged decision-makers
- Prioritize high-impact connections
Now sales leaders can answer confidently:
- Are we connected at the right levels?
- Are we multi-threaded within this enterprise?
- Where is influence concentrated?
- Where are we vulnerable?
That’s the power of CRM Relationship Intelligence.
How to Build Relationship Maps Faster in Dynamics 365
Speed matters. Adoption matters.
A high-performing relationship mapping solution allows users to:
- Auto-expand nodes instantly
- Apply filters dynamically
- Use quick actions without leaving the view
- Trigger automated workflows
- Export maps for leadership reviews
The result? Teams spend less time navigating forms and more time building relationships.
From CRM Data to CRM Visualization Strategy: The Real Transformation
Relationship mapping and CRM data visualization are not cosmetic upgrades.
They:
- Transform account planning
- Improve executive alignment
- Strengthen pipeline forecasting
- Enhance strategic account management
- Support AI-ready CRM environments
When relationship data becomes visual, interactive, and actionable, Dynamics 365 evolves into a strategic growth engine.
If you’re looking for an all-in-one solution that brings together CRM data visualization and relationship intelligence, then Map My Relationships stands out as the #1 CRM data visualization and relationship mapping app, highly recommended by Microsoft Dynamics 365 users.
By combining influence mapping, mind map view, structured tree visualization, hierarchy control, real-time analytics, and workflow execution into a single experience, it enables teams to move from fragmented CRM records to true relationship intelligence, all within Dynamics 365.
It transforms complex CRM structures into interactive, actionable relationship intelligence, helping teams visualize account relationships with ultimate clarity, build strategic connections faster, and unlock the true revenue potential of every key account.
Frequently Asked Questions
1. Can relationship mapping handle complex N-level hierarchies?
Yes. Advanced relationship mapping tools like Map My Relationship allow unlimited N-level drill-down so users can explore deeply nested corporate structures without navigating multiple CRM forms.
This is critical for:
- Global enterprise accounts
- Multi-entity business groups
- Multi-layer decision structures
2. How does relationship mapping support key account management (KAM)?
Relationship mapping enables key account managers to:
- Visualize account relationships with ultimate clarity
- Identify gaps in executive coverage
- Align opportunities across business units
- Monitor engagement depth across strategic stakeholders
It transforms account planning from static spreadsheets into dynamic, visual CRM Relationship Intelligence.
3. Can relationship mapping work with custom entities in Dynamics 365?
Yes. Advanced solutions like Map My Relationship extend beyond standard Accounts and Contacts and allow relationship visualization across custom entities.
This is especially useful for:
- Partner ecosystems
- Projects
- Contracts
- Regional business units
- Industry-specific models
This flexibility ensures CRM data visualization aligns with your unique business structure.
Conclusion
If your CRM holds valuable relationship data but your teams struggle to see the full picture, the challenge is not data availability; it’s data visibility.
With advanced relationship mapping, mind map view, tree view, and hierarchy control:
- You can visualize account relationships with clarity.
- You can understand influence networks deeply.
- You can build stronger strategic connections.
- And you can unlock the full revenue potential of your key accounts.
Because in modern B2B selling, relationships aren’t flat records.
They’re dynamic networks, and the teams that see the network win.
Start a 15-day free trial from the Inogic Website or Microsoft Marketplace and experience a smarter way to manage accounts, contacts, and opportunities.
Have questions or want a live demo? Reach us at crm@inogic.com, and get an exclusive walkthrough with our CRM experts.