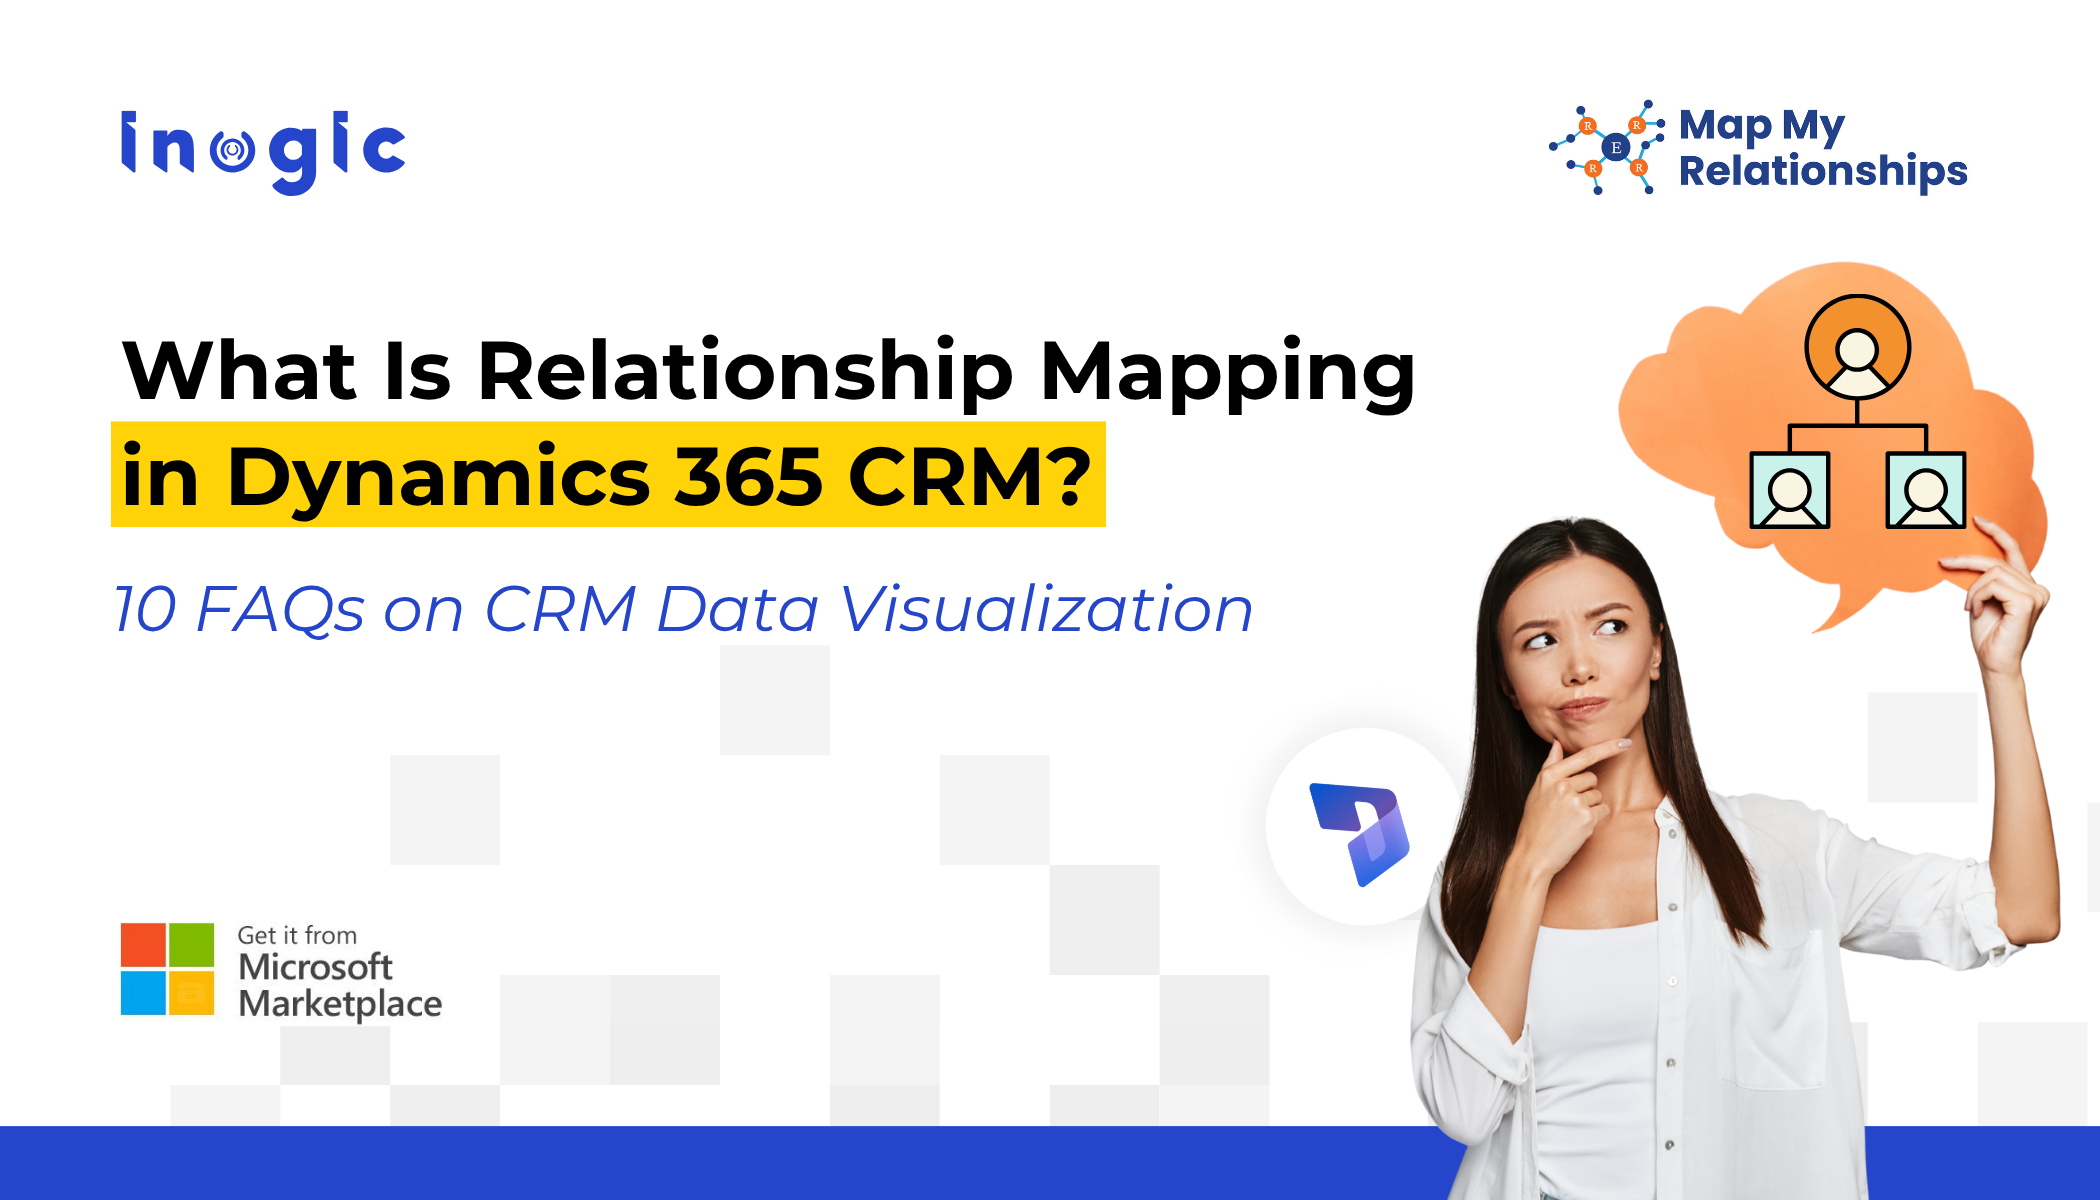
 Sales teams working in Dynamics 365 CRM often struggle to understand complex stakeholder relationships inside large accounts. Relationship mapping in Dynamics 365 CRM is a visual way to understand how accounts, contacts, stakeholders, and opportunities are connected. By transforming CRM records into visual diagrams, teams can identify decision makers, influence paths, and organizational structures more easily.
In this guide, we answer 10 common questions about relationship mapping and CRM data visualization in Dynamics 365 CRM.
What is relationship mapping in Dynamics 365 CRM, and how to implement it?
Relationship mapping in Dynamics 365 CRM is a visual way to understand how accounts, contacts, stakeholders, and opportunities are connected. Instead of analyzing raw records or lists, CRM users can see relationships through visual diagrams, helping them identify key decision makers, influence paths, and hidden connections that affect sales outcomes.
Relationship mapping helps CRM teams:
- Visualize connections between accounts, contacts, and opportunities
- Identify decision makers and influencers
- Understand organizational hierarchies
- Discover hidden relationships that affect deals
Modern relationship mapping tools like mind maps using Map My Relationship, hierarchy views, and influence maps make relationship mapping easier by transforming complex CRM data into clear visual networks.
How does relationship mapping help close deals in Dynamics 365 CRM?
Relationship mapping helps close deals faster by identifying the right people to engage within a customer organization. By visualizing decision makers, influencers, and reporting structures, sales teams can prioritize key contacts and build stronger engagement strategies that accelerate deal progression.
Relationship mapping enables sales teams to:
- Identify decision makers vs influencers
- Understand reporting structures
- Track existing relationships across accounts
- Plan multi-threaded sales strategies
Visual CRM tools like Map My Relationship allow teams to see who knows whom, which improves outreach and stakeholder engagement.
How can you visualize relationships between accounts and contacts in Dynamics 365?
You can visualize relationships between accounts and contacts in Dynamics 365 by using CRM visualization tools that convert relational data into visual diagrams such as mind maps, hierarchy trees, or organizational charts. These views make it easier to understand how stakeholders are connected across accounts and opportunities.
Typical CRM visualization methods include:
- Mind Map View – displays connections between contacts and stakeholders
- Hierarchy View – shows account structures
- Tree View – visualizes parent-child relationships
- Influence Mapping – identifies key decision makers
Solutions like relationship mapping apps for Dynamics 365 enable these visualizations directly inside the CRM interface.
What is influence mapping in CRM relationship management?
Influence mapping is a CRM technique used to identify the people who influence purchasing decisions within an organization. Instead of focusing only on primary contacts, influence maps visualize connections between stakeholders, helping sales teams understand internal dynamics and build stronger relationship strategies.
Influence mapping helps teams:
- Identify champions and blockers
- Understand internal stakeholder influence
- Plan targeted engagement strategies
- Navigate complex enterprise accounts
Advanced CRM visualization tools like Map My Relationship represent influence relationships using interactive relationship maps
What are the best ways to visualize complex CRM relationships?
The best ways to visualize complex CRM relationships include using mind maps, hierarchy charts, tree views, and network diagrams. These visualization methods transform CRM records into structured visual models that help users understand connections, organizational structures, and influence paths quickly.
Popular CRM visualization approaches include:
| Visualization Type | Purpose |
| Mind Map | Shows relationship networks |
| Hierarchy Chart | Displays organizational structure |
| Tree View | Maps parent-child relationships |
| Influence Map | Shows decision-making power |
Modern Dynamics 365 tools like Map My Relationship integrate these views directly within CRM dashboards.
 Can Dynamics 365 CRM show account hierarchies visually?
 Can Dynamics 365 CRM show account hierarchies visually?
Yes, Dynamics 365 CRM can display account hierarchies visually using hierarchy charts and relationship visualization tools. These visual structures help CRM users understand parent companies, subsidiaries, and business unit relationships within large organizations.
Account hierarchy visualization helps with:
- Enterprise account management
- Understanding corporate structures
- Planning account-based sales strategies
- Managing multi-location customers
Advanced CRM apps like Map My Relationship enhance these capabilities by providing interactive hierarchy views and relationship diagrams.
What is the best tool for relationship mapping in Dynamics 365 CRM?
The best relationship mapping tools for Dynamics 365 CRM allow users to visualize complex relationships through multiple interactive views such as mind maps, tree diagrams, and influence maps. These tools help sales and relationship managers understand stakeholder networks and account structures without leaving the CRM environment.
An effective relationship mapping solution should provide:
- Mind Map relationship visualization
- Account hierarchy charts
- Influence mapping
- Tree and network views
- Interactive CRM relationship diagrams
Solutions like Map My Relationships transform Dynamics 365 data into visual relationship intelligence, making it easier for teams to analyze connections and manage complex accounts.
What is stakeholder mapping in CRM?
Stakeholder mapping in CRM is the process of identifying and visualizing individuals who influence purchasing decisions within an organization. By mapping stakeholders, sales teams can understand relationships between decision makers, influencers, and internal champions.
Stakeholder mapping helps with:
- Enterprise deal management
- Account-based selling strategies
- Influence identification
- Strategic relationship planning
Visualization tools often represent stakeholders through interactive relationship diagrams.
What is influence mapping in Dynamics 365 Sales?
Influence mapping is a technique used to identify how different stakeholders affect purchasing decisions within an organization. Instead of focusing only on primary contacts, influence maps show how decision makers, influencers, and internal champions are connected.
Influence mapping helps sales teams:
- Understand internal power dynamics
- Identify champions and blockers
- Plan targeted engagement strategies
- Navigate complex enterprise sales cycles
CRM visualization tools often represent influence relationships using interactive maps.
What Is Account Relationship Mapping in CRM?
Account relationship mapping in CRM is the process of visually representing how contacts, departments, subsidiaries, and partner organizations are connected to a customer account. Instead of viewing isolated records, relationship maps display these connections in a structured visual format, helping sales teams understand influence networks, organizational structures, and key stakeholders.
Account relationship mapping typically includes:
- Mapping internal contacts: Identifying how decision makers, influencers, and end users are connected within an organization.
- Mapping partner relationships: Understanding connections between customers, vendors, resellers, or strategic partners involved in the business ecosystem.
- Mapping subsidiaries and parent companies: Visualizing corporate structures such as holding companies, regional branches, and business units.
- Tracking cross-account connections: Discovering relationships between contacts who interact with multiple accounts, departments, or opportunities.
These relationships are often visualized using relationship network diagrams, org charts, hierarchy charts, or stakeholder maps, allowing CRM users to quickly interpret complex account structures and engagement pathways. Tools designed for CRM relationship visualization can transform standard CRM records into interactive relationship maps, making it easier to analyze stakeholder influence and manage complex enterprise accounts.
Relationship mapping transforms traditional CRM records into visual relationship intelligence. By combining stakeholder mapping, influence visualization, and account hierarchy views, sales teams gain a clearer understanding of complex customer ecosystems inside Dynamics 365.
Get a 15-day free trial from Inogic Website or Microsoft Marketplace. If you want an end to end implementation demo, reach out to us at crm@inogic.com.