Still Using CRM Like It’s 2010? Let’s Talk Visuals.
According to a data report, many CRM users feel overwhelmed by cluttered data and complicated navigation. That’s a lot of missed opportunities — and miscommunication.
Scrolling through endless records and tabs isn’t helping anyone close deals faster. So, what if your CRM showed you exactly what you need — instantly?
Imagine this:
- A drag-and-drop board to manage your sales pipeline at a glance
- A relationship mind map revealing all connections around key accounts
- A checklist guiding your team step-by-step through every process
Sounds good?
In this blog, we’ll explore 3 must have visualization apps in Dynamics 365 CRM that help you work smarter, stay focused, and never miss a step.
Let’s jump in!
Kanban Board – Turn Records into Actionable Cards
Have you ever wanted your CRM to feel more like a Trello board — but for sales?
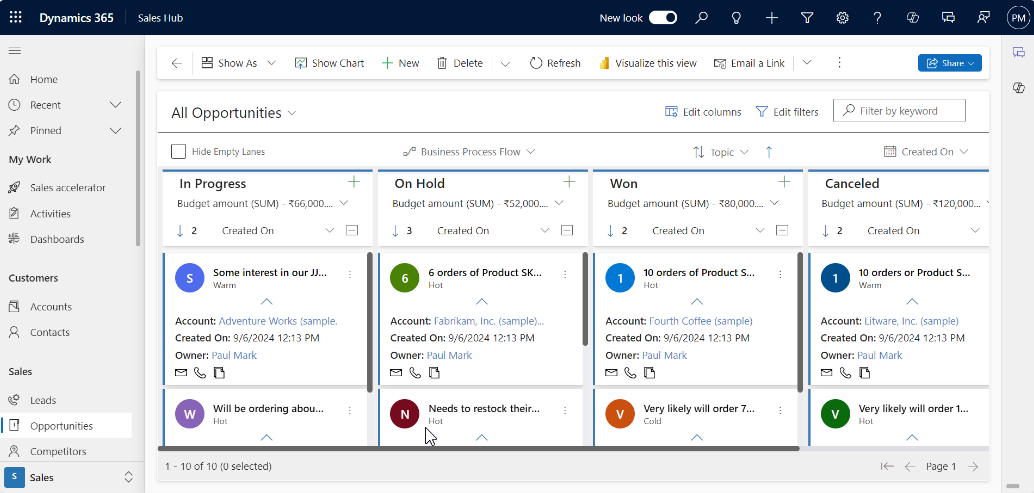
With Kanban Board, you get just that. Instead of endless tables of leads and opportunities, you see cards arranged by status or stage.
Key Features:
- Visualize records in columns (e.g., stages, priority)
- Drag-and-drop to update status instantly
- Use Swimlanes to group records by owner, region, or priority for faster insights
- Customize card layouts to show key data
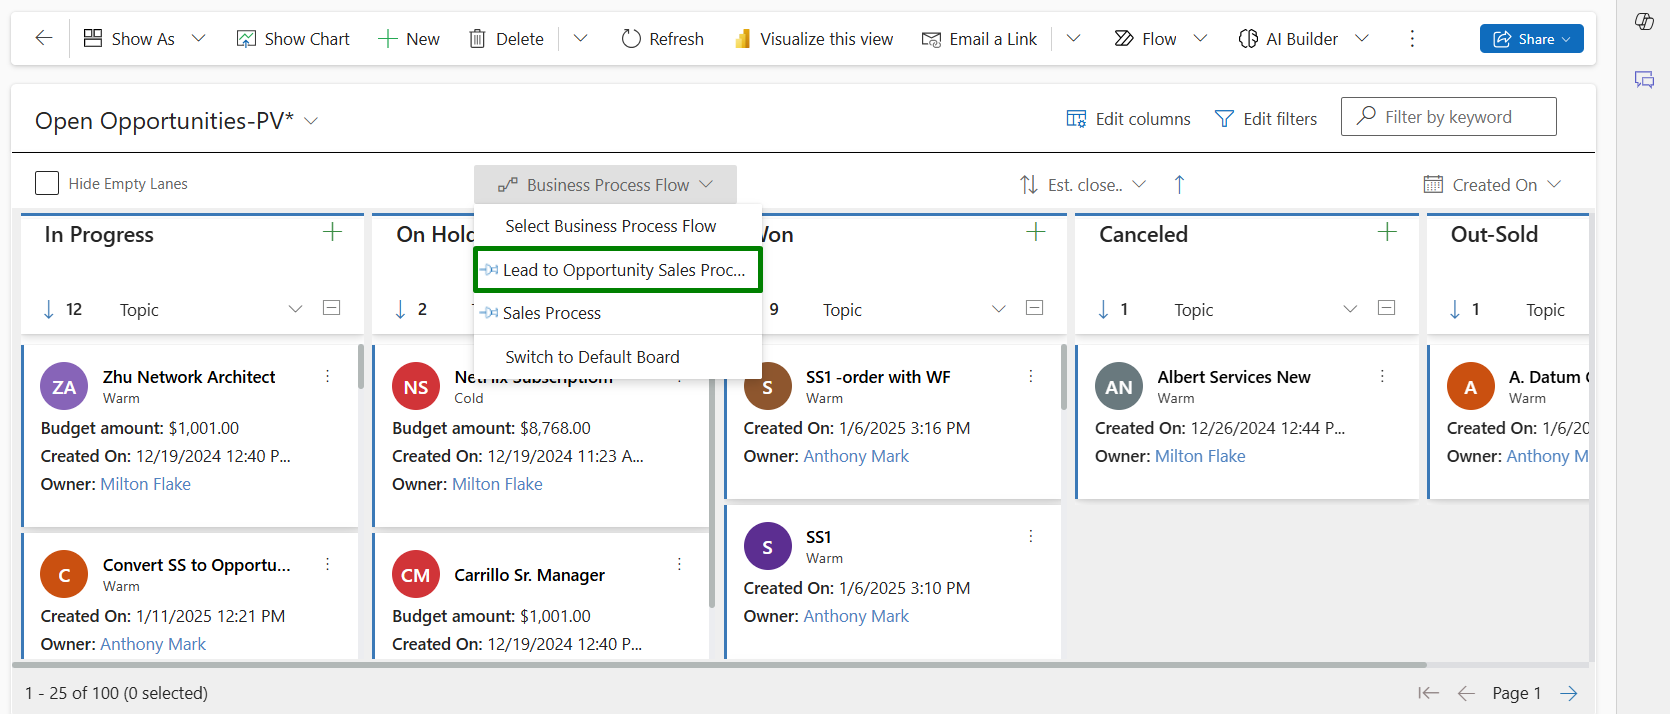
- View and manage processes that span across multiple entities
Use Case:
A sales rep starts the day with the Kanban view of their open opportunities. One quick glance tells them what’s in “Proposal Sent” — and with one drag, they move a closed deal to “Won.” CRM updates instantly.
Map My Relationships – Understand Relationships at a Glance
Ever tried to understand a complex account with 10+ related records?
Normally, you’d be opening record after record. But with Map My Relationships, you get a 360° visual map showing how everything connects — people, cases, opportunities, contracts, and more.
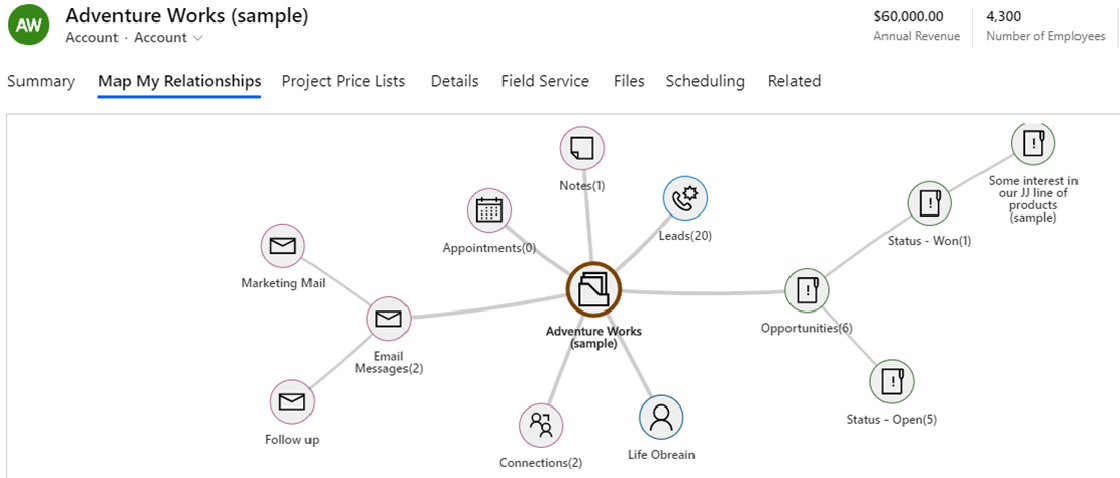
Key Features:
- Visual mind map of related records from one screen
- Color-coded icons for record types
- Create or edit related records from the map
- Hover to preview record details
- Works with parent-child and N:N relationships
- Hierarchy View to clearly visualize account hierarchies in a tree format
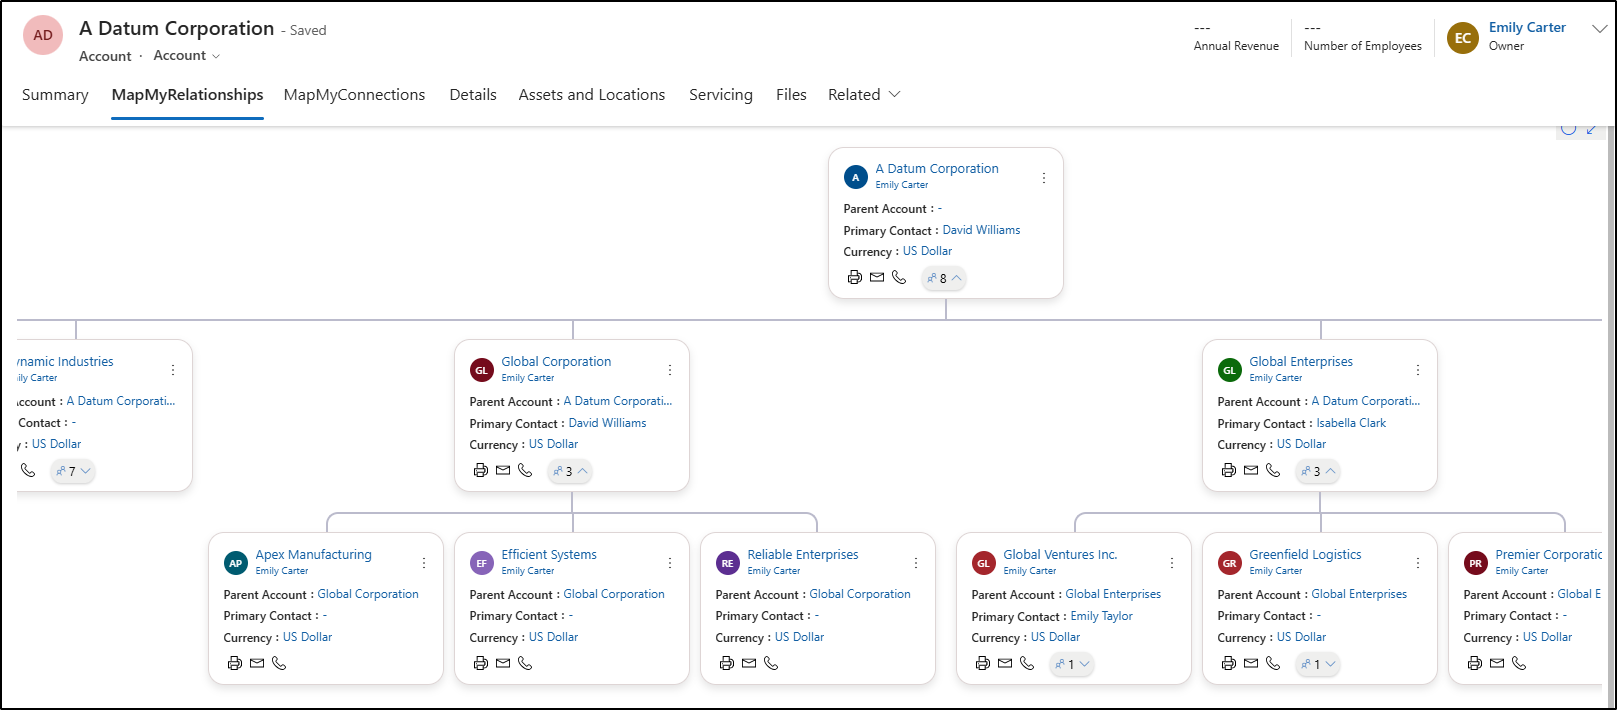
Use Case:
An account manager views a strategic client and instantly sees linked contacts, support tickets, ongoing opportunities, and past invoices — all orbiting around the account in a spider-style map. Everything clicks.
Business Process Checklist – Your CRM’s Guided Pathway
You’ve defined your sales process, but how do you ensure everyone actually follows it?
Meet Business Process Checklist—a smart tool that attaches to CRM records and walks your team through each step of the process.
Whether it’s qualifying leads, closing deals, or onboarding clients, this app turns business rules into an interactive checklist—no micromanaging required.
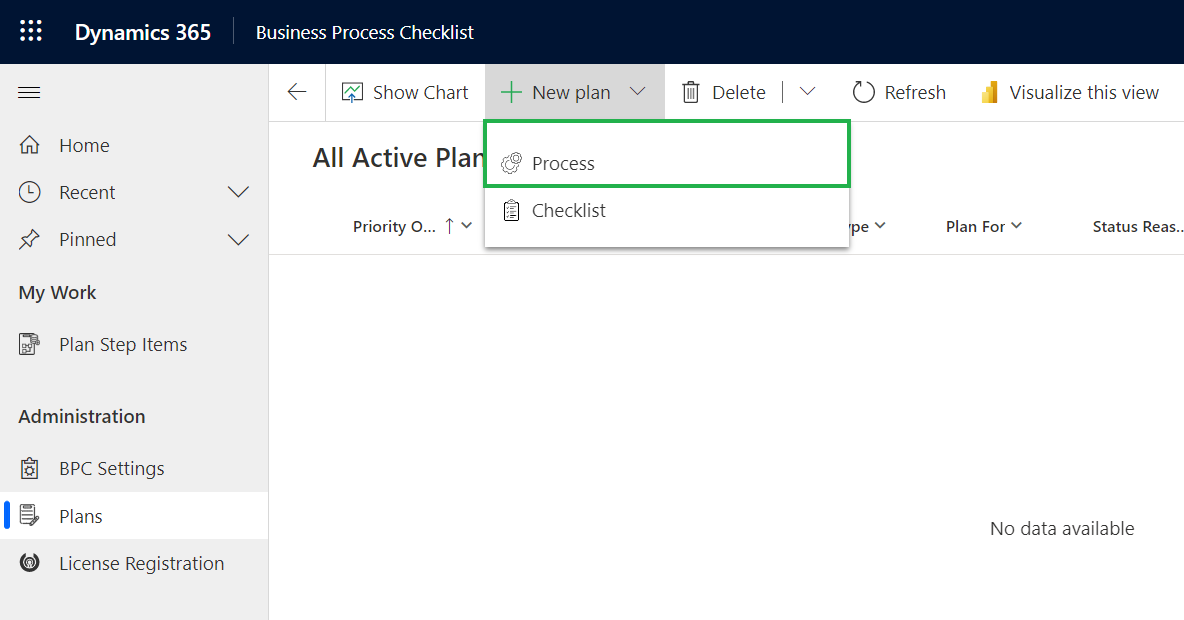
Key Features:
- Create sequential or flexible checklists
- Auto-attach checklists to records based on logic (e.g., source = “Web”)
- Track progress with visual indicators
- Assign due dates and actions (calls, emails, etc.)
- Easily revise and migrate plans between environments
- Resume plans after failures (e.g., license issues)
Use Case:
A new SDR opens a lead. Instantly, a “Lead Nurture Plan” checklist appears — call the lead, verify interest, schedule a demo. They complete each step directly in the record, with due dates, reminders, and zero guesswork.
In a world where attention is short and data is overwhelming, visualization tools in Dynamics 365 CRM are your unfair advantage.
They don’t just make your data pretty—they make your teams smarter, faster, and more consistent.
So, go ahead, visualize to optimize.
Your CRM (and your customers) will thank you.
Ready to supercharge your CRM visualization?
Try one (or all!) of these apps with a 15-day free trial from Microsoft AppSource or Inogic’s website.
For more info or a personalized demo, drop a mail at crm@inogic.com.